Combination the Stochastic %D and the Stochastic %K
_SECTION_BEGIN(“Stochastic %D”);
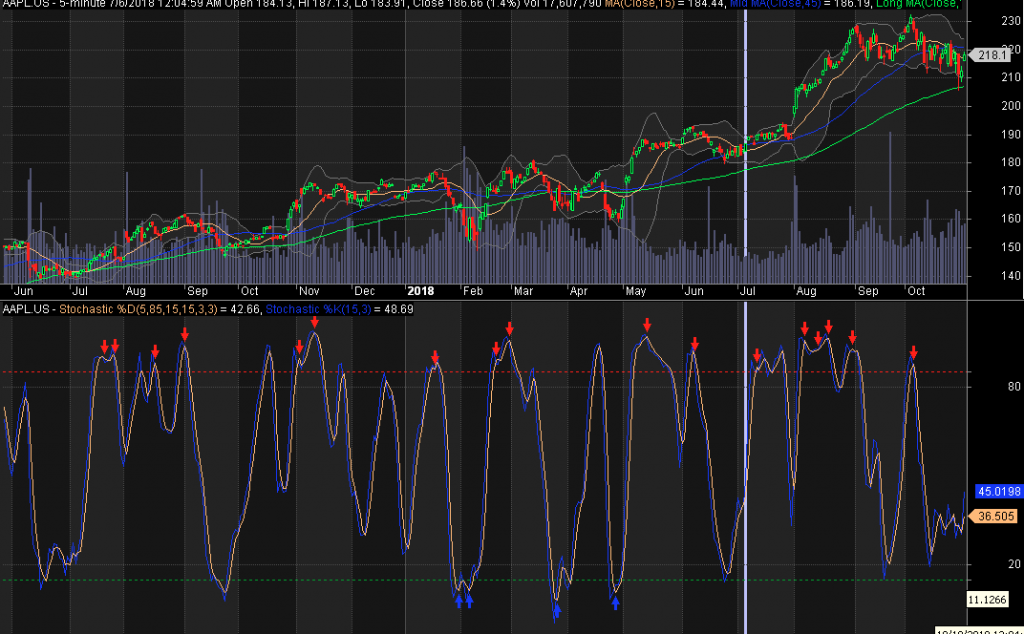
SetChartOptions(0, 0, chartGrid20 | chartGrid80);
GraphXSpace = Param(“GraphXSpace”, 5, -10, 20, 1);
OBthreshold = Param("OBthreshold", 85, 75, 100, 5); OSthreshold = Param("OSthreshold", 15, 0, 25, 5); PlotGrid(OBthreshold, colorRed, 8, 1, False); PlotGrid(OSthreshold, colorGreen, 8, 1, False); periods = Param("Periods", 15, 1, 200, 1); Ksmooth = Param("%K avg", 3, 1, 200, 1); Dsmooth = Param("%D avg", 3, 1, 200, 1); Plot(StochD(periods, Ksmooth, DSmooth), _DEFAULT_NAME(), ParamColor("Color", colorCycle), ParamStyle("Style"));
_SECTION_END();
_SECTION_BEGIN(“Stochastic %K”);
periods = Param(“Periods”, 15, 1, 200, 1);
Ksmooth = Param(“%K avg”, 3, 1, 200, 1);
Plot(StochK(periods, Ksmooth), _DEFAULT_NAME(), ParamColor(“Color”, colorCycle), ParamStyle(“Style”));
Buy = StochK(periods, Ksmooth) < OSthreshold AND Cross(StochK(periods, Ksmooth), StochD(periods, Ksmooth, DSmooth)); PlotShapes(IIf(Buy, shapeUpArrow, shapeNone), colorBlue); Sell = StochK(periods, Ksmooth) > OBthreshold AND Cross(StochD(periods, Ksmooth, DSmooth), StochK(periods, Ksmooth)); PlotShapes(IIf(Sell, shapeDownArrow, shapeNone), colorRed);
_SECTION_END();
Leave a Reply
You must be logged in to post a comment.