Keltner Band is a promising indicator to determine trend breakouts accurately. And experienced traders might very well know that catching accurate trend breakouts is as good a finding a fortune. Keltner band calculates the price range based on ATR (average true range), which is different from standard deviation calculation that Bollinger band uses. In this post, we would understand Keltner band calculation steps and explore a trading system based on it. This trading system is backtested on NSE Nifty for past 18 years and results are decent enough.
Get it from tradingtuitions.com. Thank guys.
_SECTION_BEGIN(“Keltner Channel trading System”);
SetChartOptions(0,chartShowArrows|chartShowDates);
_N(Title = StrFormat(“{{FULLNAME}} – {{INTERVAL}} {{DATE}} Open %g, Hi %g, Lo %g, Close %g (%.1f%%) {{VALUES}}”, O, H, L, C, SelectedValue( ROC( C, 1 ) ) ));
//Initial Parameters
SetTradeDelays( 0,0,0, 0 );
SetOption( “InitialEquity”, 200000);
SetOption(“FuturesMode” ,True);
SetOption(“MinShares”,1);
SetOption(“CommissionMode”,2);
SetOption(“CommissionAmount”,50);
SetOption(“AccountMargin”,10);
SetOption(“RefreshWhenCompleted”,True);
SetPositionSize(150,spsShares);
SetOption( “AllowPositionShrinking”, True );
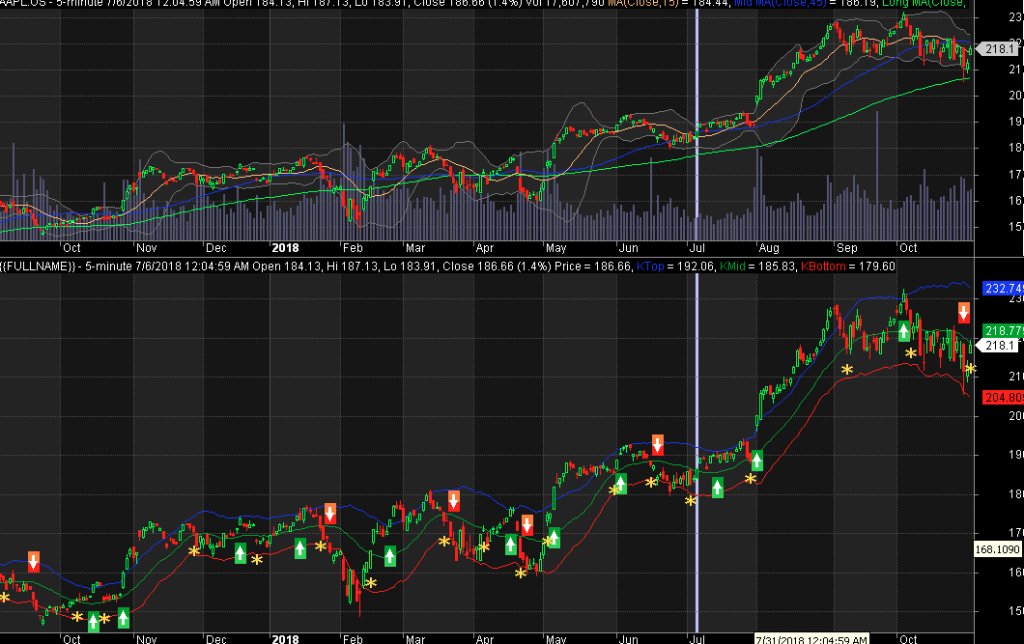
Plot( Close, “Price”, colorWhite, styleCandle );
//Keltner Band Code
KMid = MA (Close, 20); //Middle Line
ATRPeriod = 10; //ATR Period
KFactor = 2; //Multiplier
KValue = ATR(ATRPeriod) * KFactor;
KTop = KMid + KValue; //Upper Band
KBottom = KMid – KValue; //Lower Ban
printf(“\nKTop : ” + KTop );
printf(“\nKBottom : ” + KBottom );
printf(“\nKMid : ” + KMid );
Plot(KTop,”KTop”,colorBlue,styleLine);
Plot(KMid,”KMid”,colorGreen,styleLine);
Plot(KBottom,”KBottom”,colorRed,styleLine);
Buy=Cross(High,KTop);
Short=Cross(KBottom,Low);
Sell=Cross(KMid,Low);
Cover=Cross(High,KMid);
BuyPrice=KTop;
SellPrice=KMid;
ShortPrice=KBottom;
CoverPrice=KMid;
Buy = ExRem(Buy,Sell);
Sell = ExRem(Sell,Buy);
Short=ExRem(Short,Cover);
Cover=ExRem(Cover,Short);
printf(“\nBuy : ” + Buy );
printf(“\nSell : ” + Sell );
printf(“\nShort : ” + Short );
printf(“\nCover : ” + Cover );
/* Plot Buy and Sell Signal Arrows */
PlotShapes(IIf(Buy, shapeSquare, shapeNone),colorGreen, 0, L, Offset=-25);
PlotShapes(IIf(Buy, shapeSquare, shapeNone),colorLime, 0,L, Offset=-35);
PlotShapes(IIf(Buy, shapeUpArrow, shapeNone),colorWhite, 0,L, Offset=-30);
PlotShapes(IIf(Short, shapeSquare, shapeNone),colorRed, 0, H, Offset=25);
PlotShapes(IIf(Short, shapeSquare, shapeNone),colorOrange, 0,H, Offset=35);
PlotShapes(IIf(Short, shapeDownArrow, shapeNone),colorWhite, 0,H, Offset=-30);
PlotShapes(IIf(Sell, shapeStar, shapeNone),colorGold, 0, L, Offset=-15);
PlotShapes(IIf(Cover, shapeStar, shapeNone),colorGold, 0,L, Offset=-15);
_SECTION_END();
Leave a Reply
You must be logged in to post a comment.