Hi All,
This is a very basic strategy using RSI which i personally also use quite often.
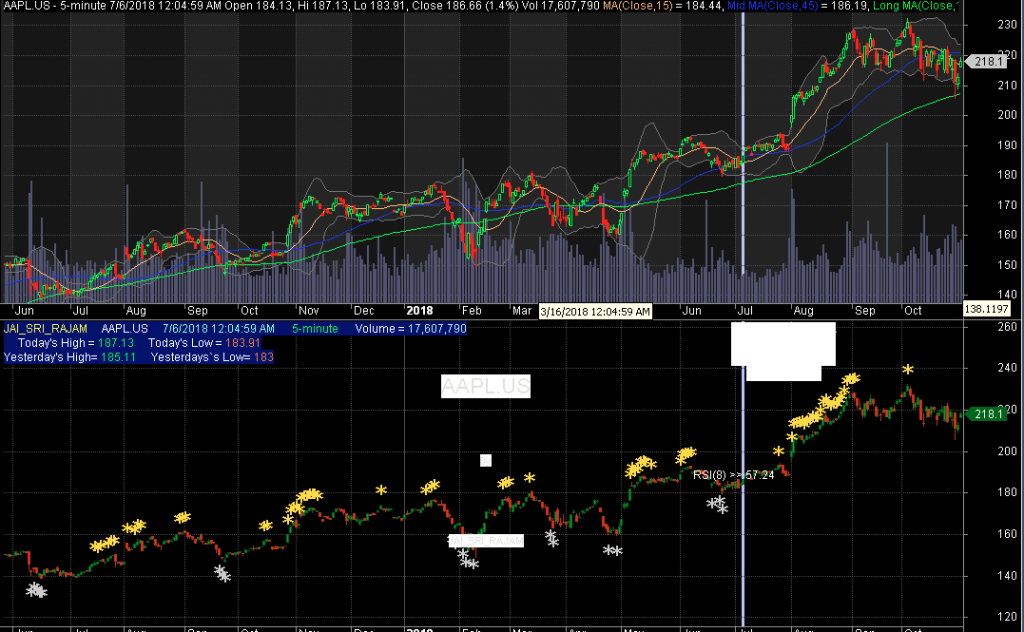
It includes money money management and Entry and exit signals.
Enter at buy sell arrows and exit at stars which are oversold/overbought zones.
Explorer is also made available by which you can the stocks in live market.
Also can manage risk Amount in parameter and buy or sell qty is displayed accordingly.
This is my first post here, forgive me for my mistakes if any.
I am not a master in AFLs hence used my logic but taken help from others AFLs to give shape for my AFL, thanks to all for the same.
Try and share your feed backs, thank U…
///Jai Sri Rajam
_SECTION_BEGIN(“Title”);
SetChartOptions(0,chartShowDates);
GraphXSpace=10;
dec = (Param(“Decimals”,2,0,7,1)/10)+1;
PH = TimeFrameGetPrice(“H”, inDaily, -1); // Yesterdays high
PL = TimeFrameGetPrice(“L”, inDaily, -1); //Yesterday’s Low
TH = TimeFrameGetPrice(“H”, inDaily, 0); // Today’s high
TL = TimeFrameGetPrice(“L”, inDaily, 0); //Today’s Low
if( Status(“action”) == actionIndicator )
(Title = EncodeColor(colorYellow)+ “JAI_SRI_RAJAM” + ” ” + EncodeColor(55)+ Name() + ” ” + EncodeColor(colorAqua) + Date() + ” ” + EncodeColor(5) + “{{INTERVAL}} ” + EncodeColor(55)+ ” Volume = “+ EncodeColor(52)+ WriteVal(V,1) + “\n” +
EncodeColor(55)+ ” Today’s High = “+ EncodeColor(5) + WriteVal(TH,dec) +
EncodeColor(55)+ ” Today’s Low = “+ EncodeColor(colorOrange)+ WriteVal(TL,dec) +
“\n” +
EncodeColor(55)+ “Yesterday’s High= ” + EncodeColor(colorBrightGreen) + PH + EncodeColor(55)+ ” Yesterdays`s Low= ” + EncodeColor(colorOrange) + PL);
_SECTION_END();
_SECTION_BEGIN(“Background text”);
C13=Param(“fonts”,20,10,30,1 );
C14=Param(“left-right”,2.1,1.0,5.0,0.1 );
C15=Param(“up-down”,6,1,20,1 );
Miny = Status(“axisminy”);
Maxy = Status(“axismaxy”);
lvb = Status(“lastvisiblebar”);
fvb = Status(“firstvisiblebar”);
pxwidth = Status(“pxwidth”);
pxheight = Status(“pxheight”);
GfxSetBkMode(transparent=-1);
GfxSetOverlayMode(0);
GfxSelectFont(“Candara”, Status(“pxheight”)/C13 );
GfxSetTextAlign( 6 );
GfxSetTextColor( ColorRGB (217,217,213));
GfxTextOut( Name(), Status(“pxwidth”)/C14, Status(“pxheight”)/C15 );
GfxSelectFont(“Tahoma”, Status(“pxheight”)/C130.5 ); GfxSetTextColor( ColorRGB (217,217,213)); GfxTextOut( “By”, Status(“pxwidth”)/C14, Status(“pxheight”)/C152.5 );
GfxSelectFont(“Candara”, Status(“pxheight”)/C130.5 ); GfxSetTextColor( ColorRGB (217,217,213)); GfxTextOut( “JAI_SRI_RAJAM”, Status(“pxwidth”)/C14, Status(“pxheight”)/C154 );
GfxSelectFont(“MS Sans Serif”, 10, 500, False, False, 0);
_SECTION_END();
_SECTION_BEGIN(“Background_Setting”);
GraphXSpace=25;
SetChartBkGradientFill( ParamColor(“BgTop”, colorBlack),
ParamColor(“BgBottom”, colorBlack),ParamColor(“titleblock”,colorDarkTeal ));
SetBarFillColor(IIf(C>O,ParamColor(“Candle UP Color”, colorGreen),IIf(C<=O,ParamColor(“Candle Down Color”, colorRed),colorLightGrey))); Plot(C,”\nPrice”,IIf(C>O,ParamColor(“Wick UP Color”, colorDarkGreen),IIf(C<=O,ParamColor(“Wick Down Color”, colorBrown),colorLightGrey)),64,0,0,0,0);
_SECTION_END();
///Intraday time settings
FirstTradeTime = 091500; // Earliest time to take a trade
LastTradeTime = 150000; // Latest time to take new trades
ExitAllPositionsTime = 151900; // Exit all trades
_SECTION_BEGIN(“Magnified Price”);
FS=Param(“Font Size”,30,11,100,1);
GfxSelectFont(“Times New Roman”, FS, 700, True );
GfxSetBkMode( colorWhite );
GfxSetTextColor( ParamColor(“Color”,colorWhite) );
Hor=Param(“Horizontal Position”,824,1,1200,1);
Ver=Param(“Vertical Position”,1,1,830,1);
GfxTextOut(“”+C, Hor , Ver );
YC=TimeFrameGetPrice(“C”,inDaily,-1);
DD=Prec(C-YC,2);
xx=Prec((DD/YC)*100,2);
GfxSelectFont(“Times New Roman”, 11, 700, True );
GfxSetBkMode( colorWhite );
GfxSetTextColor(ParamColor(“Color”,colorYellow) );
GfxTextOut(“”+DD+” (“+xx+”%)”, Hor , Ver+45 );
_SECTION_END();
_SECTION_BEGIN(“Breakout Setting”);
Buy= RSI(8)>60 AND (TimeNum() >= FirstTradeTime AND TimeNum() <= LastTradeTime ); Sell= RSI(8)<40 AND (TimeNum() >= FirstTradeTime AND TimeNum() <= LastTradeTime ); Buyexit= RSI(8)>70;
Sellexit=RSI(8)<30;
Cover=Buy;
Short=Sell;
Cover=ExRem(Cover,Short);
Short=ExRem(Short,Cover);
Buy = ExRem(Buy, Sell);
Sell = ExRem(Sell, Buy);
BuyPrice=ValueWhen(Buy,C);
SellPrice=ValueWhen(Sell,C);
BSL=ValueWhen(Buy,L);
SSL=ValueWhen(Sell,H);
BRange=BuyPrice-BSL;
SRange=SSL-SellPrice;
RS=Param(“RISK_AMOUNT”,500,100,10000,1);
RISK=RS;
BQTY=RISK/BRange;
TBQTY= round(BQTY);
SQTY=RISK/SRange;
TSQTY=round(SQTY);
buyShapeType = Param(“Buy Shape Type”,59,1,60,1);
sellShapeType = Param(“Sell Shape Type”,60,1,60,1);
PlotShapes(buyShapeType * Buy, ParamColor(“Buy Arrow”, colorAqua),0,Low, – 25);
PlotShapes(sellShapeType * Short, ParamColor(“Short Arrow”, colorYellow),0,High, -25);
PlotShapes(IIf(Buyexit, shapeStar, shapeNone),colorGold, 0, H, Offset=15);
PlotShapes(IIf(Sellexit, shapeStar, shapeNone),colorLightGrey, 0,L, Offset=-15);
_SECTION_END();
_SECTION_BEGIN(“RSI at Bar”);
numbars = LastValue(Cum(Status(“barvisible”)));
fraction= IIf(StrRight(Name(),3) == “”,3.2,3.2);
hts = Param (“Text Shift”, 20,-10,100,10);
PlotText(“RSI(8) >> ” + WriteVal(RSI(8),fraction),
SelectedValue(BarIndex()+1)-(numbars/hts),SelectedValue(C),colorWhite);
_SECTION_END();
_SECTION_BEGIN(“Explorer”);
Filter = Buy OR Short;
AddColumn( IIf( Buy, 66, 1 ), “Buy”, formatChar, 55, bkcolor = IIf( Buy, 27, 55 ) );
AddColumn( IIf( Short, 83, 1 ), “Sell”, formatChar, 55, bkcolor = IIf( Short, 32, 55 ) );
AddColumn( IIf(Buy,C,IIf(Short,C,Null)) ,”ENTRY_PRICE”,1.2,colorWhite,IIf(Buy,colorBlue,IIf(Short,colorRed,colorBlack)));
AddColumn( IIf(Buy,BSL,IIf(Short,SSL,Null)) ,”SL_PRICE”,1.2,colorWhite,IIf(Buy,colorBlue,IIf(Short,colorRed,colorBlack)));
AddColumn( IIf(Buy,TBQTY,IIf(Short,TSQTY,Null)) ,”TRADE_QTY”,1.2,colorWhite,IIf(Buy,colorBlue,IIf(Short,colorRed,colorBlack)));
_SECTION_END();

Leave a Reply
You must be logged in to post a comment.