Volume based intraday trading strategy, suitable for algo traders. Buy and Sell conditions are based on previous day Volume. Trigger price, start Time, end time, stop loss and target has been added.
///Volume Based Intraday AFl for algo traders
///Created by Team Viatrades
///viatradess@gmail.com
SetPositionSize(1, spsShares);
SetBarsRequired(sbrAll, sbrAll);
SetChartOptions(0,chartShowArrows|chartShowDates);
SetChartBkGradientFill(colorBlack,colorBlack,colorBlack);
SetBarFillColor(IIf(C>O,colorPaleBlue,IIf(C<=O,colorOrange,colorLightGrey))); Plot(C,”\nPrice”,IIf(C>O,colorPaleBlue,IIf(C<=O,colorOrange,colorLightGrey)),64|styleNoTitle,0,0,0,0);
GraphXSpace = 10;
// Time Given for MCX You can Change this
StartTime = ParamTime(“Start Time”, “10:00:00”);
StopTime = ParamTime(“End Time”, “23:00:00”);
Target = Param(“Target %”, 1, 0.1, 50, 0.01)/100;
StopLoss = Param(“Stop Loss %”, 0.6, 0.1, 50, 0.01)/100;
DCAL = DateNum();
HCAL = 0;
HCALPrice = 0;
LCALPrice = 0;
CurDNPrice = 0;
FirDNDNPrice = DCAL[0];
TN = TimeNum();
DT = DateTime();
LDT = DT[BarCount-1];
VOLPRICECAL = Null;
VOLLOWPRICECAL = Null;
HIGPRCCALC = Null;
LOWPRCCALC = Null;
PrevDay = 0;
for(i = 1; i < BarCount; i++)
{
if(CurDNPrice != DCAL[i] && FirDNDNPrice != DCAL[i])
{
VOLPRICECAL = HCALPrice;
VOLLOWPRICECAL = LCALPrice;
CurDNPrice = DCAL[i]; HCAL = 0; HCALPrice = 0; LCALPrice = 0; HIGPRCCALC[i-1] = Null; LOWPRCCALC[i-1] = Null; } HIGPRCCALC[i] = VOLPRICECAL; LOWPRCCALC[i] = VOLLOWPRICECAL; if(HCAL < Volume[i]) { HCAL = Volume[i]; HCALPrice = High[i]; LCALPrice = Low[i]; }
}
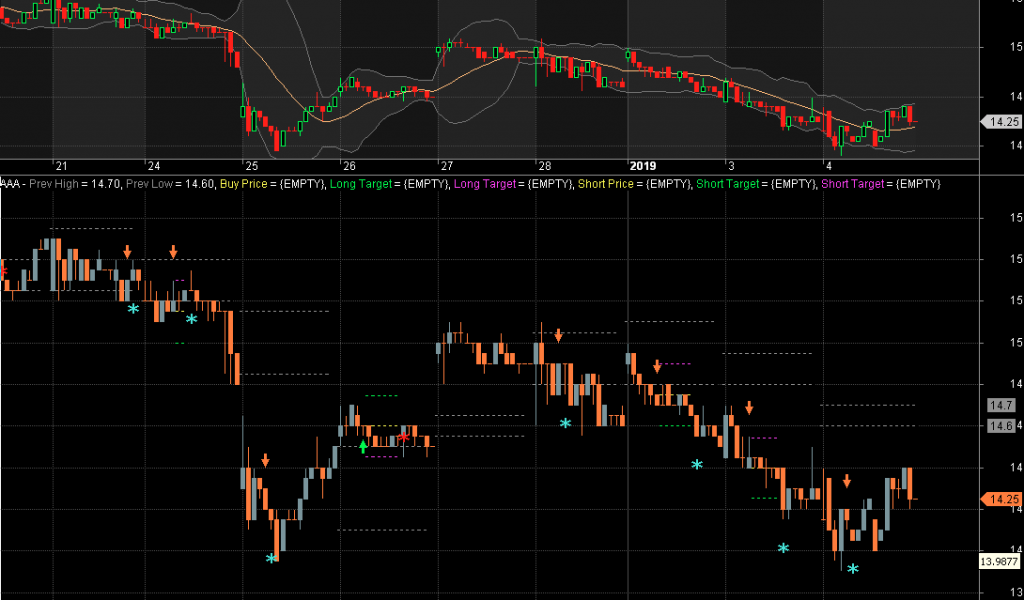
Plot(HIGPRCCALC, “Prev High”, colorGrey50, styleStaircase|styleDashed);
Plot(LOWPRCCALC, “Prev Low”, colorGrey50, styleStaircase|styleDashed);
Buy = Ref(Close > HIGPRCCALC, -1) AND TN > StartTime AND TN < StopTime AND TN > Ref(TN, -1);
Short = Ref(Close < LOWPRCCALC, -1) AND TN > StartTime AND TN < StopTime AND TN > Ref(TN, -1);
Sell = Ref(Close < LOWPRCCALC, -1) OR TN >= StopTime;
Cover = Ref(Close > HIGPRCCALC, -1) OR TN >= StopTime;
Buy = ExRem(Buy, Sell);
Sell = ExRem(Sell, Buy);
Short = ExRem(Short, Cover);
Cover = ExRem(Cover, Short);
BuyPrice = ValueWhen(Buy, Open);
ShortPrice = ValueWhen(Short, Open);
SellPrice = ValueWhen(Sell, Open);
CoverPrice = ValueWhen(Cover, Open);
LongTargetPrice = BuyPrice + (BuyPrice * Target);
ShortTargetPrice = ShortPrice – (ShortPrice * Target);
LongSLPrice = BuyPrice – (BuyPrice * Target);
ShortSLPrice = ShortPrice + (ShortPrice * Target);
Sell1 = High > LongTargetPrice;
Sell2 = Low < LongSLPrice;
Cover1 = Low < ShortTargetPrice; Cover2 = High > ShortSLPrice;
Sell = Sell OR Sell1 OR Sell2;
Cover = Cover OR Cover1 OR Cover2;
SellPrice = IIf(Sell1, LongTargetPrice, IIf(Sell2, LongSLPrice, SellPrice));
CoverPrice = IIf(Cover1, ShortTargetPrice, IIf(Cover2, ShortSLPrice, CoverPrice));
Buy = ExRem(Buy, Sell);
Sell = ExRem(Sell, Buy);
Short = ExRem(Short, Cover);
Cover = ExRem(Cover, Short);
BuyPlotsCandles = (BarsSince(Buy)BarsSince(Short)) AND (BarsSince(Short)!=0);
Plot(IIf(BuyPlotsCandles, BuyPrice, Null), “Buy Price”, colorYellow, styleStaircase|styleDashed);
Plot(IIf(BuyPlotsCandles, LongTargetPrice, Null), “Long Target”, colorBrightGreen, styleStaircase|styleDashed);
Plot(IIf(BuyPlotsCandles, LongSLPrice, Null), “Long Target”, colorCustom12, styleStaircase|styleDashed);
Plot(IIf(ShortPlotCandles, ShortPrice, Null), “Short Price”, colorYellow, styleStaircase|styleDashed);
Plot(IIf(ShortPlotCandles, ShortTargetPrice, Null), “Short Target”, colorBrightGreen, styleStaircase|styleDashed);
Plot(IIf(ShortPlotCandles, ShortSLPrice, Null), “Short Target”, colorCustom12, styleStaircase|styleDashed);
Buyshape = Buy * shapeUpArrow;
SellShape = Sell * shapeStar;
PlotShapes( Buyshape, colorBrightGreen, 0, Low );
PlotShapes( SellShape, colorRed, 0, High );
Shortshape = Short * shapeDownArrow;
CoverShape = Cover * shapeStar;
PlotShapes( Shortshape, colorOrange, 0, High, -30);
PlotShapes( CoverShape, colorTurquoise, 0, Low, -30 );
Leave a Reply
You must be logged in to post a comment.