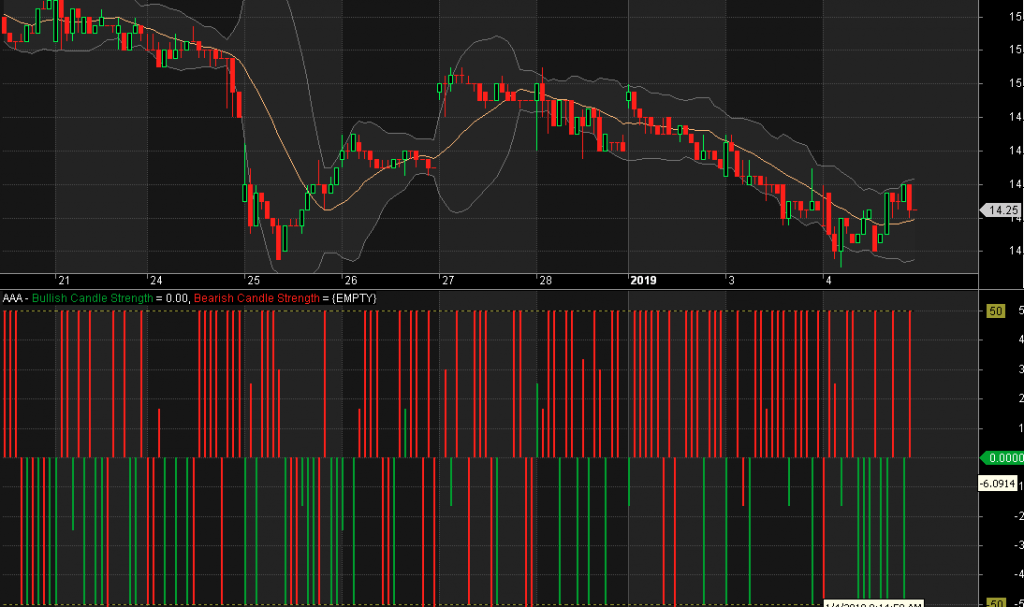
This indicator allows you to visualize the strength of the current candlestick by comparing the OHLC values. Red histogram values represent bearish candlesticks whereas green histogram values represent bullish candlesticks.
value = 100*(Open-Low)/(High-Low)-50;
bullishCandleStrength = IIf(Close > Open, value, 0);
bearishCandleStrength = IIf(Close <= Open, value, 0);
Plot(bullishCandleStrength, “Bullish Candle Strength”, colorGreen, styleHistogram | styleThick);
Plot(bearishCandleStrength, “Bearish Candle Strength”, colorRed, styleHistogram | styleThick);
Plot(50, “”, colorDarkYellow, styleDashed);
Plot(-50, “”, colorDarkYellow, styleDashed);
Leave a Reply
You must be logged in to post a comment.