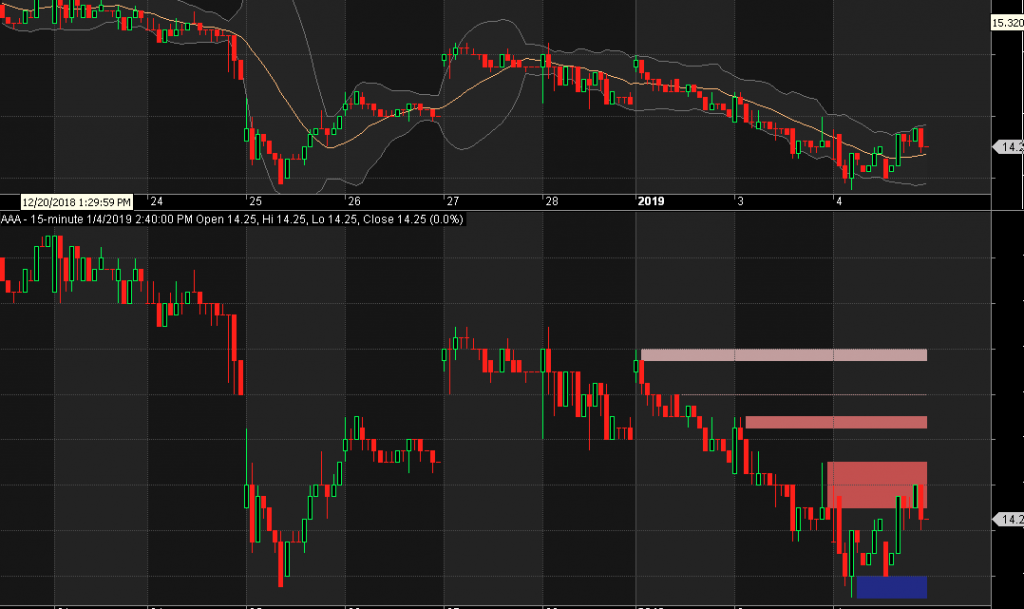
This indicator can find the Supply and Demand zone to make decide entry or exit positions. Work fine with weekly & monthly chart.
A supply zone on a chart is an area where selling interest outnumbers buying interest and the price falls until the buying-selling balance is restored. Similarly, a demand zone is a price level where price rallies because there is much more buying interest than selling interest.
Supply and demand zones can be used as additional entry information, but many traders use them to determine potential targets and exits on their trades. Once you start paying attention to supply and demand zones, you will see that they often act as price magnets where the price often gravitates towards.
Have a good trade!

_SECTION_BEGIN(“Supply and Demand Zone”);
SetChartOptions(0,chartShowArrows|chartShowDates);
_N(Title = StrFormat(“{{NAME}} – {{INTERVAL}} {{DATE}} Open %g, Hi %g, Lo %g, Close %g (%.1f%%) {{VALUES}}”, O, H, L, C, SelectedValue( ROC( C, 1 ) ) ));
Plot( C, “Close”, ParamColor(“Color”, colorDefault ), styleNoTitle | ParamStyle(“Style”) | GetPriceStyle() );
g = Param( “No.of Lines”, 7, 1, 7, 1 );
x = Cum( 1 );
pk = BarsSince( H >= Ref( H, -1 ) AND H >= Ref( H, -2 ) AND H >= Ref( H, -3 ) AND H >= Ref( H, -4 ) AND H >= Ref( H, 1 ) AND H >= Ref( H, 2 ) AND H >= Ref( H, 3 ) AND H >= Ref( H, 4 ) ) == 0;
tk = BarsSince( L <= Ref( L, -1 ) AND L <= Ref( L, -2 ) AND L <= Ref( L, -3 ) AND L <= Ref( L, -4 ) AND L <= Ref( L, 1 ) AND L <= Ref( L, 2 ) AND L <= Ref( L, 3 ) AND L <= Ref( L, 4 ) ) == 0;
px1 = LastValue( ValueWhen( pk, x, 1 ) );
px2 = LastValue( ValueWhen( Pk, x, 2 ) );
px3 = LastValue( ValueWhen( Pk, x, 3 ) );
px4 = LastValue( ValueWhen( pk, x, 4 ) );
px5 = LastValue( ValueWhen( Pk, x, 5 ) );
px6 = LastValue( ValueWhen( Pk, x, 6 ) );
px7 = LastValue( ValueWhen( Pk, x, 7 ) );
tx1 = LastValue( ValueWhen( Tk, x, 1 ) );
tx2 = LastValue( ValueWhen( Tk, x, 2 ) );
tx3 = LastValue( ValueWhen( Tk, x, 3 ) );
tx4 = LastValue( ValueWhen( Tk, x, 4 ) );
tx5 = LastValue( ValueWhen( Tk, x, 5 ) );
tx6 = LastValue( ValueWhen( Tk, x, 6 ) );
tx7 = LastValue( ValueWhen( Tk, x, 7 ) );
XT1 = LastValue( ValueWhen( pk, H, 1 ) );
XT1c = LastValue( ValueWhen( pk, Max( C, O ), 1 ) );
XT2 = LastValue( ValueWhen( Pk, H, 2 ) );
XT2c = LastValue( ValueWhen( pk, Max( C, O ), 2 ) );
XT3 = LastValue( ValueWhen( Pk, H, 3 ) );
XT3c = LastValue( ValueWhen( pk, Max( C, O ), 3 ) );
XT4 = LastValue( ValueWhen( pk, H, 4 ) );
XT4c = LastValue( ValueWhen( pk, Max( C, O ), 4 ) );
XT5 = LastValue( ValueWhen( Pk, H, 5 ) );
XT5c = LastValue( ValueWhen( pk, Max( C, O ), 5 ) );
XT6 = LastValue( ValueWhen( Pk, H, 6 ) );
XT6c = LastValue( ValueWhen( pk, Max( C, O ), 6 ) );
XT7 = LastValue( ValueWhen( Pk, H, 7 ) );
XT7c = LastValue( ValueWhen( pk, Max( C, O ), 7 ) );
YT1 = LastValue( ValueWhen( tk, L, 1 ) );
YT1c = LastValue( ValueWhen( tk, Min( O, C ), 1 ) );
YT2 = LastValue( ValueWhen( tk, L, 2 ) );
YT2c = LastValue( ValueWhen( tk, Min( O, C ), 2 ) );
YT3 = LastValue( ValueWhen( tk, L, 3 ) );
YT3c = LastValue( ValueWhen( tk, Min( O, C ), 3 ) );
YT4 = LastValue( ValueWhen( tk, L, 4 ) );
YT4c = LastValue( ValueWhen( tk, Min( O, C ), 4 ) );
YT5 = LastValue( ValueWhen( tk, L, 5 ) );
YT5c = LastValue( ValueWhen( tk, Min( O, C ), 5 ) );
YT6 = LastValue( ValueWhen( tk, L, 6 ) );
YT6c = LastValue( ValueWhen( tk, Min( O, C ), 6 ) );
YT7 = LastValue( ValueWhen( tk, L, 7 ) );
YT7c = LastValue( ValueWhen( tk, Min( O, C ), 7 ) );
pk1 = IIf( x > px1 AND HHV( H, x – px1 )= 1, XT1, Null );
pk1c = IIf( x > px1 AND HHV( H, x – px1 )= 1, XT1c, Null );
for( i = BarCount – 1; i > px1; i– )
{
if( H[i] > pk1[px1] )
{
pk1 = pk1c = Null;
}
}
Col1 = IIf( LastValue( C ) > pk1, ColorRGB( 14, 14, 100 ), ColorRGB( 180, 20, 20 ) );
PlotOHLC( 0, pk1, pk1c, 0, “”, Col1, styleCloud | styleNoLabel, Null, Null, Null, -1 );
pk2 = IIf( x > px2 AND HHV( H, x – px2 )= 2, XT2, Null );
pk2c = IIf( x > px2 AND HHV( H, x – px2 )= 2, XT2c, Null );
for( i = BarCount – 1; i > px2; i– )
{
if( H[i] > pk2[px2] )
{
pk2 = pk2c = Null;
}
}
Col2 = IIf( LastValue( C ) > pk2, ColorRGB( 24, 24, 120 ), ColorRGB( 180, 40, 40 ) );
PlotOHLC( 0, pk2, pk2c, 0, “”, Col2, styleCloud | styleNoLabel, Null, Null, Null, -2 );
pk3 = IIf( x > px3 AND HHV( H, x – px3 )= 3, XT3, Null );
pk3c = IIf( x > px3 AND HHV( H, x – px3 )= 3, XT3c, Null );
for( i = BarCount – 1; i > px3; i– )
{
if( H[i] > pk3[px3] )
{
pk3 = pk3c = Null;
}
}
Col3 = IIf( LastValue( C ) > pk3, ColorRGB( 34, 34, 140 ), ColorRGB( 180, 60, 60 ) );
PlotOHLC( 0, pk3, pk3c, 0, “”, Col3, styleCloud | styleNoLabel, Null, Null, Null, -3 );
pk4 = IIf( x > px4 AND HHV( H, x – px4 )= 4, XT4, Null );
pk4c = IIf( x > px4 AND HHV( H, x – px4 )= 4, XT4c, Null );
for( i = BarCount – 1; i > px4; i– )
{
if( H[i] > pk4[px4] )
{
pk4 = pk4c = Null;
}
}
Col4 = IIf( LastValue( C ) > pk4, ColorRGB( 44, 44, 160 ), ColorRGB( 180, 80, 80 ) );
PlotOHLC( 0, pk4, pk4c, 0, “”, Col4, styleCloud | styleNoLabel, Null, Null, Null, -4 );
pk5 = IIf( x > px5 AND HHV( H, x – px5 )= 5, XT5, Null );
pk5c = IIf( x > px5 AND HHV( H, x – px5 )= 5, XT5c, Null );
for( i = BarCount – 1; i > px5; i– )
{
if( H[i] > pk5[px5] )
{
pk5 = pk5c = Null;
}
}
Col5 = IIf( LastValue( C ) > pk5, ColorRGB( 54, 54, 180 ), ColorRGB( 180, 100, 100 ) );
PlotOHLC( 0, pk5, pk5c, 0, “”, Col5, styleCloud | styleNoLabel, Null, Null, Null, -5 );
pk6 = IIf( x > px6 AND HHV( H, x – px6 )= 6, XT6, Null );
pk6c = IIf( x > px6 AND HHV( H, x – px6 )= 6, XT6c, Null );
for( i = BarCount – 1; i > px6; i– )
{
if( H[i] > pk6[px6] )
{
pk6 = pk6c = Null;
}
}
Col6 = IIf( LastValue( C ) > pk6, ColorRGB( 64, 64, 200 ), ColorRGB( 180, 120, 120 ) );
PlotOHLC( 0, pk6, pk6c, 0, “”, Col6, styleCloud | styleNoLabel, Null, Null, Null, -6 );
pk7 = IIf( x > px7 AND HHV( H, x – px7 )= 7, XT7, Null );
pk7c = IIf( x > px7 AND HHV( H, x – px7 )= 7, XT7c, Null );
for( i = BarCount – 1; i > px7; i– )
{
if( H[i] > pk7[px7] )
{
pk7 = pk7c = Null;
}
}
Col7 = IIf( LastValue( C ) > pk7, ColorRGB( 74, 74, 220 ), ColorRGB( 180, 140, 140 ) );
PlotOHLC( 0, pk7, pk7c, 0, “”, Col7, styleCloud | styleNoLabel, Null, Null, Null, -7 );
tl1 = IIf( x > tx1 AND LLV( L, x – tx1 ) > YT1 AND g >= 1, YT1, Null );
tl1c = IIf( x > tx1 AND LLV( L, x – tx1 ) > YT1 AND g >= 1, YT1c, Null );
for( i = BarCount – 1; i > tx1; i– )
{
if( L[i] < tl1[tx1] )
{
tl1 = tl1c = Null;
}
}
Col1 = IIf( LastValue( C ) > tl1, ColorRGB( 14, 14, 100 ), ColorRGB( 180, 20, 20 ) );
PlotOHLC( 0, tl1, tl1c, 0, “”, Col1, styleCloud | styleNoLabel, Null, Null, Null, -1 );
tl2 = IIf( x > tx2 AND LLV( L, x – tx2 ) > YT2 AND g >= 2, YT2, Null );
tl2c = IIf( x > tx2 AND LLV( L, x – tx2 ) > YT2 AND g >= 2, YT2c, Null );
for( i = BarCount – 1; i > tx2; i– )
{
if( L[i] < tl2[tx2] )
{
tl2 = tl2c = Null;
}
}
Col2 = IIf( LastValue( C ) > YT2, ColorRGB( 24, 24, 120 ), ColorRGB( 180, 40, 40 ) );
PlotOHLC( 0, tl2, tl2c, 0, “”, Col2, styleCloud | styleNoLabel, Null, Null, Null, -2 );
tl3 = IIf( x > tx3 AND LLV( L, x – tx3 ) > YT3 AND g >= 3, YT3, Null );
tl3c = IIf( x > tx3 AND LLV( L, x – tx3 ) > YT3 AND g >= 3, YT3c, Null );
for( i = BarCount – 1; i > tx3; i– )
{
if( L[i] < tl3[tx3] )
{
tl3 = tl3c = Null;
}
}
Col3 = IIf( LastValue( C ) > YT3, ColorRGB( 34, 34, 140 ), ColorRGB( 180, 60, 60 ) );
PlotOHLC( 0, tl3, tl3c, 0, “”, Col3, styleCloud | styleNoLabel, Null, Null, Null, -3 );
tl4 = IIf( x > tx4 AND LLV( L, x – tx4 ) > YT4 AND g >= 4, YT4, Null );
tl4c = IIf( x > tx4 AND LLV( L, x – tx4 ) > YT4 AND g >= 4, YT4c, Null );
for( i = BarCount – 1; i > tx4; i– )
{
if( L[i] < tl4[tx4] )
{
tl4 = tl4c = Null;
}
}
Col4 = IIf( LastValue( C ) > YT4, ColorRGB( 44, 44, 160 ), ColorRGB( 180, 80, 80 ) );
PlotOHLC( 0, tl4, tl4c, 0, “”, Col4, styleCloud | styleNoLabel, Null, Null, Null, -4 );
tl5 = IIf( x > tx5 AND LLV( L, x – tx5 ) > YT5 AND g >= 5, YT5, Null );
tl5c = IIf( x > tx5 AND LLV( L, x – tx5 ) > YT5 AND g >= 5, YT5c, Null );
for( i = BarCount – 1; i > tx5; i– )
{
if( L[i] < tl5[tx5] )
{
tl5 = tl5c = Null;
}
}
Col5 = IIf( LastValue( C ) > YT5, ColorRGB( 54, 54, 180 ), ColorRGB( 180, 100, 100 ) );
PlotOHLC( 0, tl5, tl5c, 0, “”, Col5, styleCloud | styleNoLabel, Null, Null, Null, -5 );
tl6 = IIf( x > tx6 AND LLV( L, x – tx6 ) > YT6 AND g >= 6, YT6, Null );
tl6c = IIf( x > tx6 AND LLV( L, x – tx6 ) > YT6 AND g >= 6, YT6c, Null );
for( i = BarCount – 1; i > tx6; i– )
{
if( L[i] < tl6[tx6] )
{
tl6 = tl6c = Null;
}
}
Col6 = IIf( LastValue( C ) > YT6, ColorRGB( 64, 64, 200 ), ColorRGB( 180, 120, 120 ) );
PlotOHLC( 0, tl6, tl6c, 0, “”, Col6, styleCloud | styleNoLabel, Null, Null, Null, -6 );
tl7 = IIf( x > tx7 AND LLV( L, x – tx7 ) > YT7 AND g >= 7, YT7, Null );
tl7c = IIf( x > tx7 AND LLV( L, x – tx7 ) > YT7 AND g >= 7, YT7c, Null );
for( i = BarCount – 1; i > tx7; i– )
{
if( L[i] < tl7[tx7] )
{
tl7 = tl7c = Null;
}
}
Col7 = IIf( LastValue( C ) > YT7, ColorRGB( 74, 74, 220 ), ColorRGB( 180, 140, 140 ) );
PlotOHLC( 0, tl7, tl7c, 0, “”, Col7, styleCloud | styleNoLabel, Null, Null, Null, -7 );
_SECTION_END();
Leave a Reply
You must be logged in to post a comment.