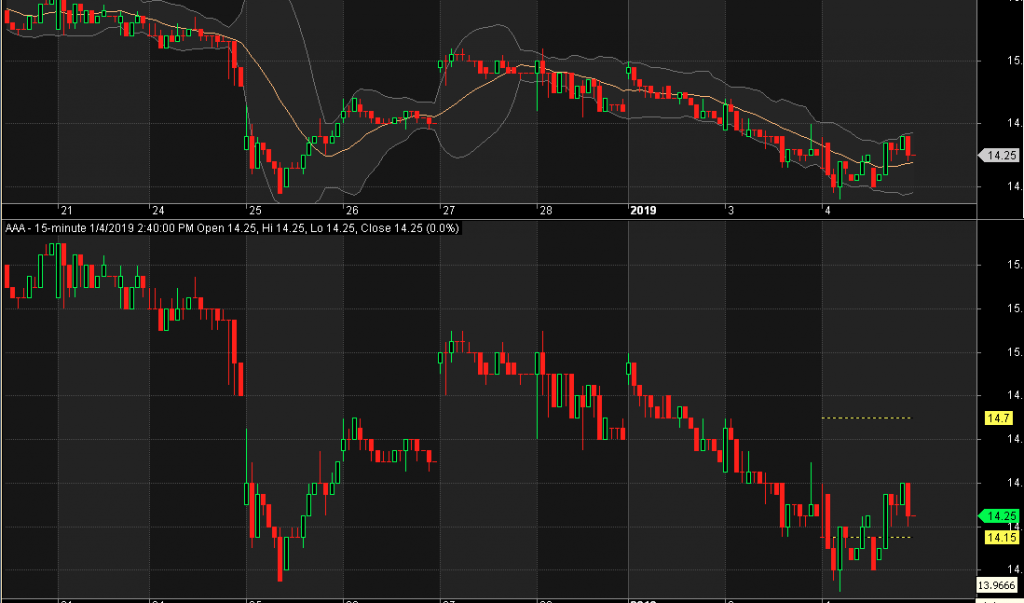
This code allows you to plot the previous days high and low price on an intraday chart. It also has exploration code to find stocks where the current price is greater than the previous days high or where the current price is less than the previous days low.
Credit to trash on traderji forums for the plotting code
_SECTION_BEGIN( “Price Chart” );
SetChartOptions( 0, chartShowArrows | chartShowDates );
_N( Title = StrFormat( “{{NAME}} – {{INTERVAL}} {{DATE}} Open %g, Hi %g, Lo %g, Close %g (%.1f%%) {{VALUES}}”, O, H, L, C, SelectedValue( ROC( C, 1 ) ) ) );
Plot( C, “Close”, ParamColor( “Color”, colorBrightGreen ), styleNoTitle | ParamStyle( “Style” ) | GetPriceStyle() );
_SECTION_END();
_SECTION_BEGIN(“Previous Days High & Low”);
function CDL( array )
{
doy = DayOfYear();
Lastdoy = doy == LastValue( doy );
Dayline = array * Lastdoy;
return IIf( Dayline, Dayline, Null );
}
H1 = TimeFrameGetPrice( “H”, inDaily, -1 );
L1 = TimeFrameGetPrice( “L”, inDaily, -1 );
Plot( cdl( H1 ), “”, colorYellow, styleLine + styleDashed + styleNoRescale );
Plot( cdl( L1 ), “”, colorYellow, styleLine + styleDashed + styleNoRescale );
Buy = C > H1;
Sell = C < L1;
Buy = ExRem( Buy, Sell );
Sell = ExRem( Sell, Buy );
Filter = Buy OR Sell ;
SetOption( “NoDefaultColumns”, True );
AddTextColumn( Name(), “Symbol”, 1.0, colorDefault, colorDefault, 80 );
AddColumn( DateTime(), “Date”, formatDateTime, colorDefault, colorDefault, 70 );
AddColumn( C, “CMP”, 1.2, colorDefault, colorDefault, 80 );
AddTextColumn( WriteIf( Buy, “Previous Day High Break”, “Previous Day Low Break” ), “Trade”, 1.0, colorDefault, colorDefault, 50 );
_SECTION_END();
Leave a Reply
You must be logged in to post a comment.