
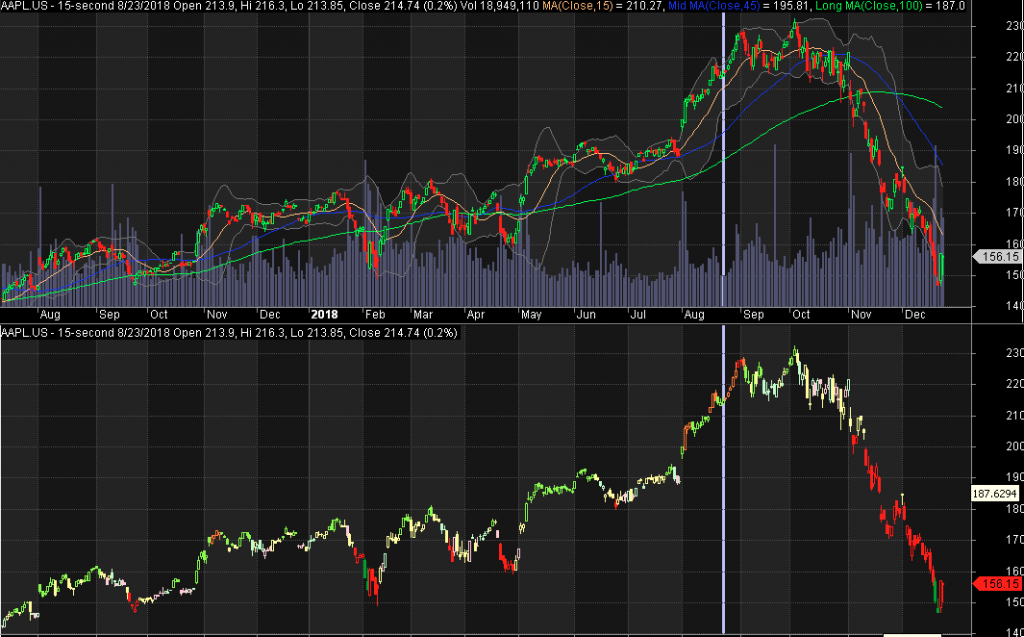
Candle-color changes as per RSI value. If candle color is red then RSI is in bear zone and if candle color is green the RSI is in bull zone.
Neutral Zone – RSI in between 45 and 55
(RSI Period can be changed from chart-property-settings)
_SECTION_BEGIN(“RSI Candle”);
Period = Param(“RSI Period”, 14, 7, 50, 1);
RSI_Value = RSI(Period);
BarColor = IIf( (RSI_Value > 60 AND RSI_Value < 75), colorRGB(128, 255, 0), IIf( (RSI_Value > 75 AND RSI_Value < 85), colorOrange, IIf( (RSI_Value > 85), colorRed,
IIf( (RSI_Value > 50 AND RSI_Value < 55), ColorRGB(185,255,185), IIf( (RSI_Value < 50 AND RSI_Value > 45), colorPink,
IIf( (RSI_Value <40 AND RSI_Value > 25), colorRed,
IIf( (RSI_Value <25 AND RSI_Value > 15), colorGreen,
IIf( (RSI_Value < 15), colorRGB(128, 255, 0), ColorRGB(255,255,128)))))))));
_SECTION_END();
_SECTION_BEGIN(“Price”);
SetChartOptions(0,chartShowArrows|chartShowDates);
_N(Title = StrFormat(“{{NAME}} – {{INTERVAL}} {{DATE}} Open %g, Hi %g, Lo %g, Close %g (%.1f%%) {{VALUES}}”, O, H, L, C, SelectedValue( ROC( C, 1 ) ) ));
Plot( C, “”, BarColor, styleCandle);
_SECTION_END();

Leave a Reply
You must be logged in to post a comment.