Code Amibroker Indicators

Bull vs Bear

by admin December 28, 2018 1 min read 0 comments

Key Takeaways

  • Market conditions and their impact on trading decisions
  • Key levels and price action analysis
  • Risk management strategies for this setup

Bull power vs Bear power – Histogram
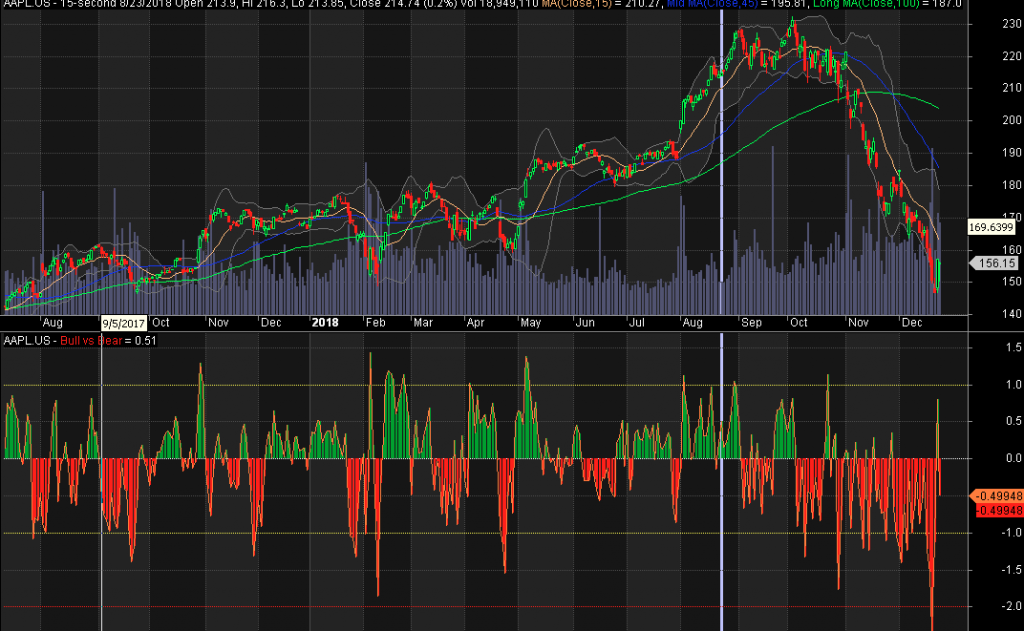
_SECTION_BEGIN("Bull vs Bear");
periods = Param( "Periods", 5, 3, 200, 1 );
Bull = (H - O)*100/C;
Bear = (L - O)*100/C;
val = Bull + Bear;
x = EMA(val,periods);
Plot(x,"", colorOrange);
dynamic_color = IIf( x> 0, colorGreen, colorRed );
Plot(x, "Bull vs Bear", dynamic_color, styleHistogram | styleThick);
PlotGrid(0, colorWhite);
PlotGrid(1, colorYellow);
PlotGrid(-1, colorYellow);
PlotGrid(2, colorGreen);
PlotGrid(-2, colorRed);
_SECTION_END();

Trading Data Snapshot

Always verify current market conditions before executing any trade. Past performance does not guarantee future results.

A
admin
Trading analyst and market commentator with expertise in technical analysis, price action, and risk management. Dedicated to helping traders make informed decisions.

Leave a Reply