Plotting volume histogram in a more beautiful area histogram chart
Overlay = ParamToggle(“MA Overlay Volume?”, ” No | Yes “, 1);
GraphZOrder = Overlay;
_SECTION_BEGIN( “Volume” );
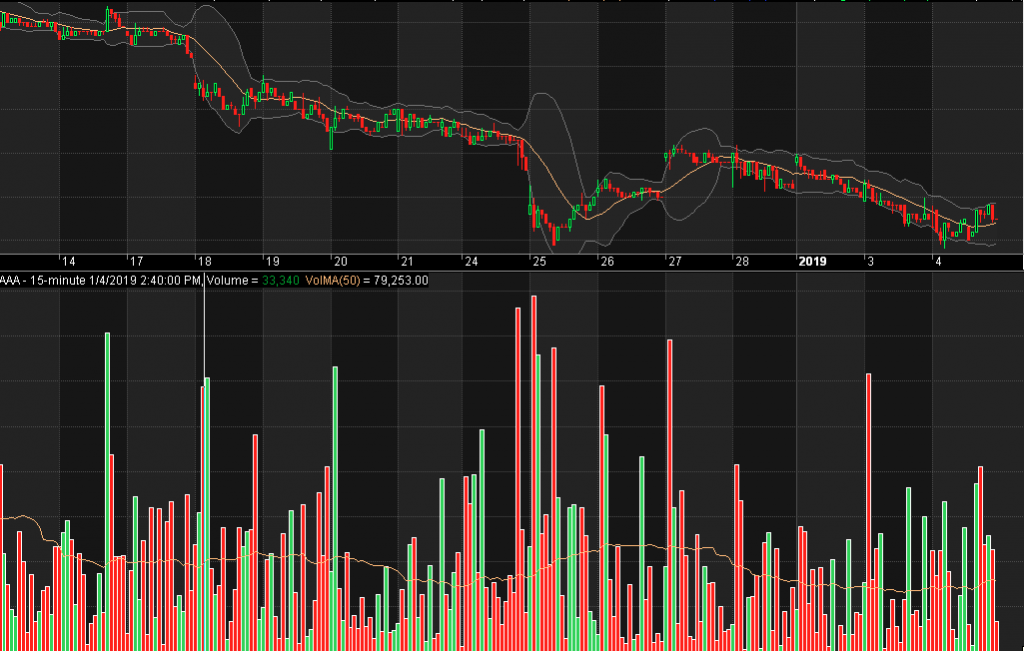
SetBarFillColor( IIf( Close > Open, colorLime, colorRed ) );
Plot( Volume, _DEFAULT_NAME(), colorWhite, styleArea |styleNoTitle );
_SECTION_END();
_SECTION_BEGIN( “VolMA” );
Periods = Param( “Periods”, 50, 2, 300, 1, 10 );
VolMA = MA(Volume,Periods);
Plot( VolMA, _DEFAULT_NAME(), ParamColor( “Color”, colorCycle ), ParamStyle( “Style” ) );
_SECTION_END();
_N(Title = StrFormat(“{{NAME}} – {{INTERVAL}} {{DATE}}, Volume = “) + EncodeColor(colorGreen) + WriteVal(V,1.0) + StrFormat(” {{VALUES}}”));
Leave a Reply
You must be logged in to post a comment.