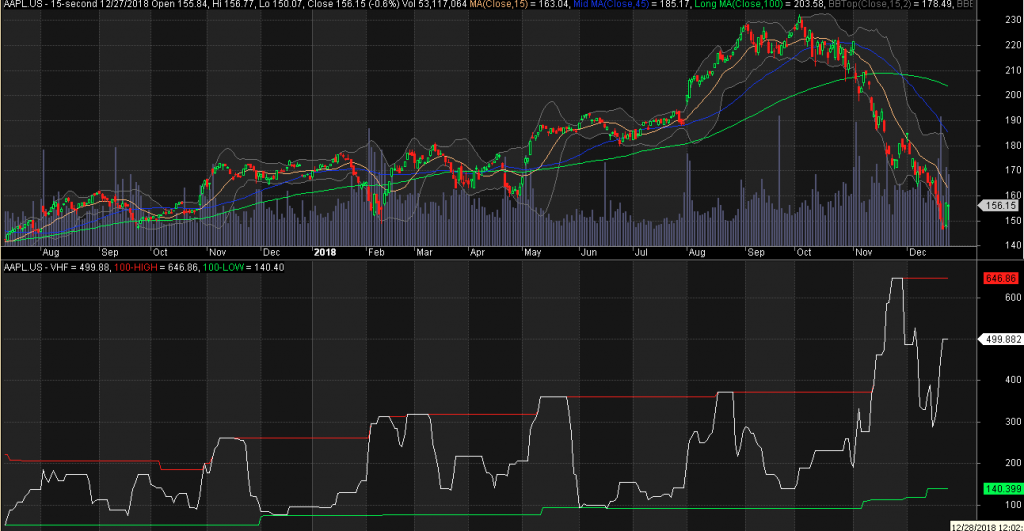
The VHF indicator measure wether the price is going horizontal (non-directional) or vertical (uni-directional), no indicator in technical analysis has this capacity.
SetBarsRequired(sbrAll,sbrAll);
VHFP = Param( “VHFPERIOD”, 20, 2, 100, 1 );
HCP = HHV( C, VHFP );
LCP = LLV( C, VHFP );
NUMERATOR = HCP – LCP;
for ( i=BarCount-1;i> BarCount-VHFP-1;i–);
{
DIFF = abs(C[i] – C[i-1]);
}
DENOMINATOR = Sum( DIFF, VHFP );
VHF = NUMERATOR*100 / DENOMINATOR;
Plot( VHF, “VHF”, colorWhite, styleLine );
HH = HHV(VHF, 100);
LL = LLV(VHF, 100);
Plot(HH, “100-HIGH”, colorRed, styleLine);
Plot(LL, “100-LOW”, colorBrightGreen, styleLine);
The indicator consist of only one simple line below price chart. There are only two main indication given by the indicator as follow:
- If the indicator value is high, it suggest a trending market and low value suggest sideway market
- If it is rising it suggest that the market will start the trend soon. And conversely the falling value suggests that the market is becoming calmer and going to be sideways.
Leave a Reply
You must be logged in to post a comment.