Trend Intensity Index (TII) was developed by M.H. Pee and it is used to measure the strength of a trend of a sock, ETF, index or any other tradable security.
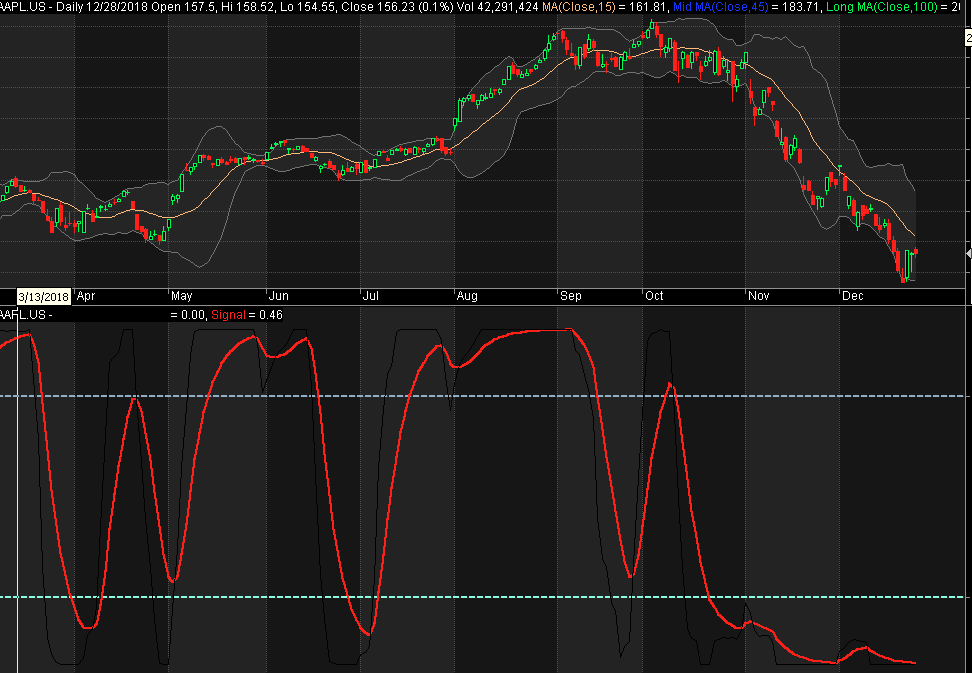
TII oscillates around 50% line in the range from 0 to 100%. The TII readings above 80% are considered as an indication of a strong bullish trend and TII readings below 20% are considered as an indication of a strong bearish rend. The movement of Trend Intensity Index toward 50% line (center line) would suggest weakening of the current trend.
sel_field = ParamField( “Field”, field = 3 );
period = Param( “Period”, 14 );
EMA_period = Param( “EMA Period”, 9 );
function TrendIntensityIndex( period, sel_field )
{
deviation_period = 0;
if( period % 2 == 0 ) { deviation_period = period / 2; } else { deviation_period = ( period + 1 ) / 2; } deviation = sel_field - MA( sel_field, period ); TII = Null; for( i = period * 2; i < BarCount; i++ ) { SDpos = 0; SDneg = 0; for( j = 0; j < deviation_period; j++ ) { if( deviation[i - j] > 0 ) { SDpos = SDpos + deviation[i - j]; } else { SDneg = SDneg + deviation[i - j]; } } TII[i] = ( ( SDpos ) / ( SDpos + abs( SDneg ) ) ) * 100; } return TII;
}
TII = TrendIntensityIndex( period, sel_field );
signalLine = EMA( TII, EMA_period );
SetChartOptions( 0, 0, ChartGrid20 | ChartGrid80 );
Plot( TII, “Trend Intensity Index”, colorBlack );
//PlotOHLC(TII,TII,50,””, IIf(signalLine > 50,colorLightBlue,colorLightOrange),styleCloud | styleClipMinMax, 20, 80 );
Plot( signalLine, “Signal”, colorRed, styleThick );
PlotGrid( 80, colorLightBlue, 9, 2 );
PlotGrid( 20, colorAqua, 9, 2 );
Leave a Reply
You must be logged in to post a comment.