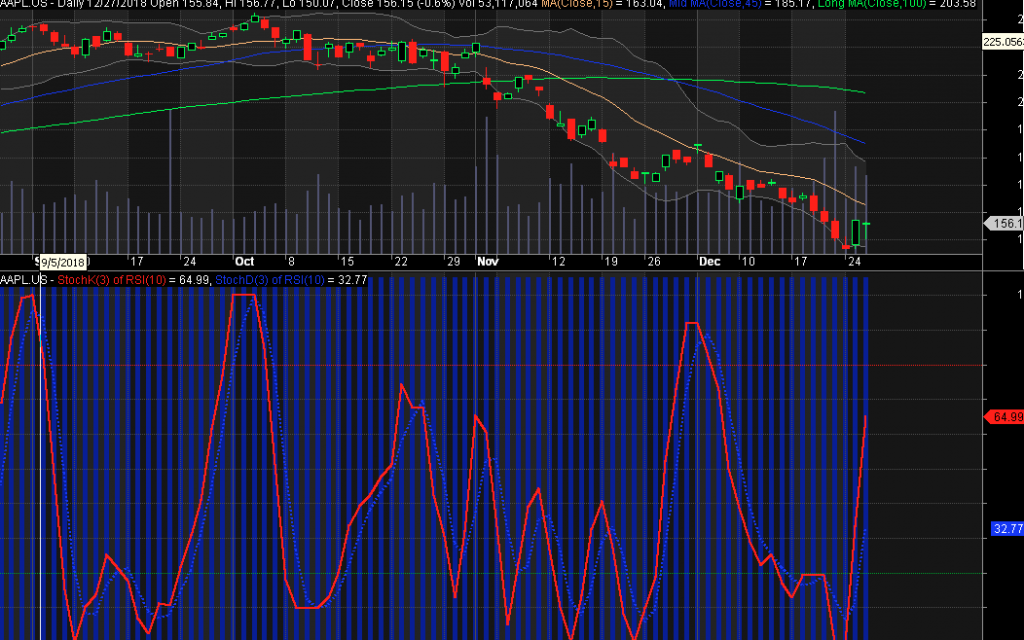
The StochRSI is an indicator used in technical analysis that ranges between zero and one and is created by applying the Stochastic Oscillator formula to a set of Relative Strength Index (RSI) values rather than standard price data.
In this formula the overbought and oversold zones are highlighted. There is also a configurable separator to show date boundaries.
_SECTION_BEGIN(“StochRSI”);
RSIperiods = Param( “RSIperiods”, 10, 1, 100, 1 );
Stochperiods = Param( “Stochperiods”, 10, 1, 100, 1 );
sep = ParamList( “Separator Interval”, “Day|Week|Month|Year”, 0 );
Kperiods = Param( “Kperiods”, 3, 1, 50, 1 );
Dperiods = Param( “Dperiods”, 3, 1, 50, 1 );
OBthreshold = Param( “OBthreshold”, 80, 55, 100, 5 );
OSthreshold = Param( “OSthreshold”, 20, 0, 50, 5 );
switch( sep ) { case "Day": dn = Day(); dn1 = inDaily; break; case "Week": dw = DayOfWeek(); newWeek = dw < Ref( dw, -1 );; newYear = Year() != Ref( Year(), -1 ); dn = weekNumber = Sum( newWeek, BarsSince( newYear ) + 1 ); dn1 = inWeekly; break; case "Month": dn = Month(); dn1 = inMonthly; break; case "Year": dn = Year(); dn1 = inYearly; break; } separator = dn != Ref( dn, -1 ); Plot( separator, "", colorDarkBlue, styleHistogram | styleOwnScale | styleNoLabel | styleNoRescale, 0, 1, 0, -2, 5 ); TheRSI = RSI( RSIperiods ); llRSI = LLV( TheRSI, Stochperiods ); hhRSI = HHV( TheRSI, Stochperiods ); StochasticRSI = 100 * ( ( TheRSI - llRSI ) / ( hhRSI - llRSI + 0.00001 ) ); StocK_rsi = MA( StochasticRSI, Kperiods ); StocD_rsi = MA( StocK_rsi, Dperiods ); Plot( StocK_rsi, "StochK(" + Kperiods + ") of RSI(" + RSIperiods + ")", colorRed, styleLine | styleThick ); Plot( StocD_rsi, "StochD(" + Dperiods + ") of RSI(" + RSIperiods + ")", colorBlue, styleDashed | styleThick ); PlotGrid( OBthreshold, colorRed, 1 ); PlotGrid( OSthreshold, colorGreen, 1 );
_SECTION_END();
Leave a Reply
You must be logged in to post a comment.