Cycles will position the plot under the specific occurance of the cycle. A value of 0 ( Default ) will position the plot at the beginning of the last cycle in the data and will show the extrapolation into future dates for as many bars as you have defined in the AB Preferences
// RescalePrice = Yes will rescale the price data to the computed cycle ( usually not necessary )
CycleLength = Param(“Cycle Length”, 208, 2, 10000, 1);
OffsetBars = Param(“Offset Bars”, 17, 0, 10000, 1);
OffsetCycles = Param(“Shift Cycles”, 0, 0, 1000, 1);
Separators = Param(“Separators Every ? Bars”, 52, 0, 100, 1);
GraphXSpace = Param(“GraphXSpace”, 5, 0, 100, 1);
RescalePrice = ParamList(“Rescale Price ?”, “No|Yes”);
SpecialData = ParamList(“Year in Vol AND Month in OI ?”, “No|Yes”);
CPISym = “”;//”CNPI-“;//”CPI_1800”;
OffsetBars = OffsetBars + CycleLength;
OffsetCycles = OffsetCycles – 1;
Cum1 = Cum(1) – 1;
LVC1 = LastValue(Cum1);
if (OffsetCycles < 0)
OffsetCycles = int(LVC1 / CycleLength);
if (OffsetCycles < 0)
OffsetCycles = 0;
Index = IIf(BarIndex() == 0, L, IIf(L < Ref(L, -1), L, IIf(H > Ref(H, -1), H, C)));
if (SpecialData == “Yes”)
{
YYYY = V;
MM = OI;
}
else
{
YYYY = Year();
MM = Month();
}
YYYYMM = 100 * YYYY + MM;
if (CPISym != “”)
CPI = Foreign(CPISym, “C”);
else
CPI = Cum(0) + 1;
IndexCD = Index / CPI;
ii = IIf(Cum1 < OffsetBars + 1, 0, int((Cum1 – OffsetBars – 1) / CycleLength) * CycleLength + OffsetBars);
iii = BarsSince(ii != Ref(ii, -1)) + OffsetBars + 1;
Za = Cum(0);
Zg = Cum(0) + 1;
N = Cum(0);
for (i = OffsetBars + 1; i < BarCount; i++)
{
Y[i] = IndexCD[i] / IndexCD[ii[i]];
Za[iii[i]] = Za[iii[i]] + Y[i]; Zg[iii[i]] = Zg[iii[i]] * Y[i]; N[iii[i]] = N[iii[i]] + 1;
}
ZZa = IIf(Cum1 > OffsetBars AND
Cum1 <= CycleLength + OffsetBars, Za / N, -1e10); ZZg = IIf(Cum1 > OffsetBars AND
Cum1 <= CycleLength + OffsetBars, Zg ^ (1 / N), -1e10);
ZZa[OffsetBars] = 1;
ZZg[OffsetBars] = 1;
ZZZa = NOT IsEmpty(Ref(ZZa, -1)) AND (BarsSince(IsEmpty(Ref(ZZa, -1)))) % Separators – 1 == 0;
ZZZg = NOT IsEmpty(Ref(ZZg, -1)) AND (BarsSince(IsEmpty(Ref(ZZg, -1)))) % Separators – 1 == 0;
Price = IIf(IsEmpty(Ref(ZZa, CycleLength)), -1e10, Ref(IndexCD, CycleLength * OffsetCycles));
PMult = LastValue(Highest(IIf(IsEmpty(Ref(Price, -1)) AND NOT IsEmpty(Price), 1 / Price, 0)));
Price = IIf(Cum1 > LVC1 – CycleLength * OffsetCycles, -1e10, Price * PMult);
if (RescalePrice == “Yes”)
{
Factor = log10(LastValue(Highest(ZZa))) / log10(LastValue(Highest(Price)));
Price = Price ^ Factor;
}
MinPlot = LastValue(Min(Lowest(IIf(ZZa > 0, ZZa, 1)), Lowest(IIf(Price > 0, Price, 1))));
MaxPlot = LastValue(Max(Highest(ZZa), Highest(Price)));
Plot(MinPlot, “”, colorDefault, styleNoDraw);
Plot(MaxPlot, “”, colorDefault, styleNoDraw);
Plot(Ref(ZZg, CycleLength), “”, colorRed, styleThick, Null, Null, CycleLength * OffsetCycles);
Plot(Ref(ZZa, CycleLength), “”, colorBlue, styleThick, Null, Null, CycleLength * OffsetCycles);
Plot(Price, “”, colorBrightGreen, styleThick, Null, Null, CycleLength * OffsetCycles);
Plot(IIf(Ref(ZZZa, CycleLength), 2, 1), “”, colorLightBlue, styleHistogram | styleNoLabel | styleOwnScale, 1, 2, CycleLength * OffsetCycles);
if (Separators > 0)
for (i = 1; i <= int(CycleLength / Separators); i++)
{
PlotText(NumToStr(i, 1.0), CycleLength * OffsetCycles + OffsetBars + int((i – 0.5) * Separators) – CycleLength + 1, MinPlot, colorWhite);
}
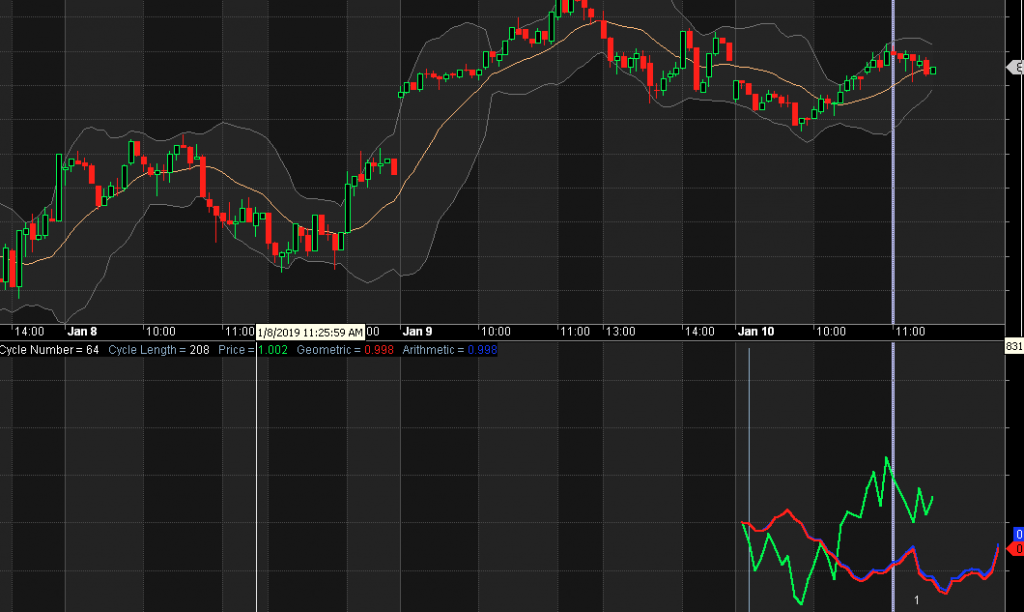
Title = “Cycle Number = ” + EncodeColor(colorWhite) + NumToStr(OffsetCycles + 1, 1.0) + ” ” + EncodeColor(colorLightBlue) +
“Cycle Length = ” + EncodeColor(colorWhite) + NumToStr(CycleLength, 1.0) + ” ” + EncodeColor(colorLightBlue) +
“Price = ” + EncodeColor(colorBrightGreen) + NumToStr(Ref(Price, -CycleLength * OffsetCycles), 1.3) + ” ” + EncodeColor(colorLightBlue) +
“Geometric = ” + EncodeColor(colorRed) + NumToStr(Ref(ZZg, – (CycleLength * OffsetCycles) + CycleLength), 1.3) + ” ” + EncodeColor(colorLightBlue) +
“Arithmetic = ” + EncodeColor(colorBlue) + NumToStr(Ref(ZZa, – (CycleLength * OffsetCycles) + CycleLength), 1.3);
SetOption(“NoDefaultColumns”, True);
Filter = 1;
AddColumn(YYYY, “YYYY”, 1.0);
AddColumn(MM, “MM”, 1.0);
AddColumn(YYYYMM, “YYYY-MM”, 1.0);
AddColumn(Cum1, “Cum1”, 1.0);
AddColumn(Index, “Index”, 1.5);
AddColumn(CPI, “CPI”, 1.5);
AddColumn(IndexCD, “Index CD”, 1.5);
AddColumn(ii, “ii”, 1.0);
AddColumn(Y, “Y”, 1.5);
AddColumn(iii, “iii”, 1.0);
AddColumn(Za, “Za”, 1.5);
AddColumn(N, “N”, 1.0);
AddColumn(ZZa, “ZZa”, 1.5);
AddColumn(PMult, “PMult”, 1.5);
Leave a Reply
You must be logged in to post a comment.