One of the most reliable chart patterns.
Bull traps occur when an upward breakout retreats back below a resistance level. Resistance is normally associated with two/more equal highs or an earlier major high.
- Bull traps should be traded in a down-trend.
- They may also signal reversal after an extended up-trend.
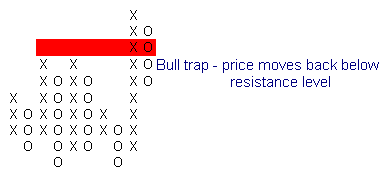
Go short when price falls back below the resistance level.

Bear Traps
Bear traps occur when a downward breakout retreats back above a support level. Support is normally associated with two/more equal lows or an earlier major low.
- Bear traps should be traded in an up-trend.
- They may also signal reversal after an extended down-trend.
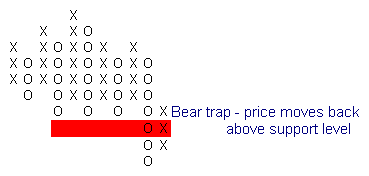
Go long when price rises above the support level.
Wide Bull and Bear Traps
Bull and bear traps (and false breaks) often occur in longer time frames as well.
Ford Motor Co. displays a bull trap that took more than a year to complete:

- Price spiked up to a new high, in early 1998, but quickly retraces.
- Resistance forms just below the previous high. The strong following correction is a bearish sign.
- Bull trap: Price rallies to a marginal new high but then retreats below the new support level.
- A short retracement confirms the trend change.
- An equal lower high confirms resistance has formed at 32.00: the low before [3]. A strong bear signal.
- Another attempted rally peters out.
- Equal highs in a down-trend are a strong bear signal; and are followed by a long downward spike.

Leave a Reply
You must be logged in to post a comment.