MACD với tín hiệu mua bán
_SECTION_BEGIN(“MA Difference 20 Period”);
//——————————————————————————
//
// This indicator displays how far the closing price is above or below a 20
// period moving average in % terms. It is displayed as a histogram and the
// bars are green if the closing price is above the MA and red if the closing
// price is below the MA.
//
// T may be changed to alter the MA period. ie Change T=20 to T=200 for the
// 200 period MA.
//
// /MA Diff 20 by Larry Lovrencic/
//
// T=20; /Time Period for MA/
//
// KMA=((C-MA(C,T))/MA(C,T))*100;
//
// GRAPH0=KMA;
//
// GRAPH0STYLE=2+4;
//
// GRAPH0BARCOLOR=iif(KMA>0,5,4);
//
// graphxspace=5;
//
// title=name()+” “+date()+” The Close is
// “+writeval(abs(KMA),format=1.2)+”%”+writeif(KMA>0,” above”,” below”)+” the
// 20 period MA”;
//
// Mark Grid lines:
//
// Level 0
//
// Limits
//
// Show dates
//
// Percent
//
// Middle
//
//——————————————————————————
/MA Diff 20 by Larry Lovrencic/
T=20; /Time Period for MA/
KMA=((C-MA(C,T))/MA(C,T))*100;
Graph0=KMA;
Graph0Style=2+4;
Graph0BarColor=IIf(KMA>0,5,4);
GraphXSpace=5;
Title=Name()+” “+Date()+” The Close is “+WriteVal(abs(KMA),format=1.2)+”%”+WriteIf(KMA>0,” above”,” below”)+” the 13 period MA”;
_SECTION_END();
_SECTION_BEGIN(“Price”);
SetChartOptions(0,chartShowArrows|chartShowDates);
_N(Title = StrFormat(“{{NAME}} – {{INTERVAL}} {{DATE}} Open %g, Hi %g, Lo %g, Close %g (%.1f%%) {{VALUES}}”, O, H, L, C, SelectedValue( ROC( C, 1 ) ) ));
Plot( C, “Close”, ParamColor(“Color”, colorBlack ), styleNoTitle | ParamStyle(“Style”) | GetPriceStyle() );
_SECTION_END();
//——————————————————————————
// Author: Stephane Carrasset
//——————————————————————————
//
// Function changes DateNum ex:1040928 en String ddmmyyyy ex:28/09/2004 ( only
// > 2000 year )
//
// Returns in Interpretation every date when occurs an Events.
//
// Example of StrFormat; StrToNum; NumToStr; printf;
//
// StaticVarSetText;
//
//——————————————————————————
_SECTION_BEGIN(“ZIG – Zig”);
P = ParamField( “Price field” );
change = Param(“% change”,1,0.1,25,0.1);
Plot( Zig(P, change), _DEFAULT_NAME(), ParamColor( “Color”, colorCycle ), ParamStyle(“Style”) );
_SECTION_END();
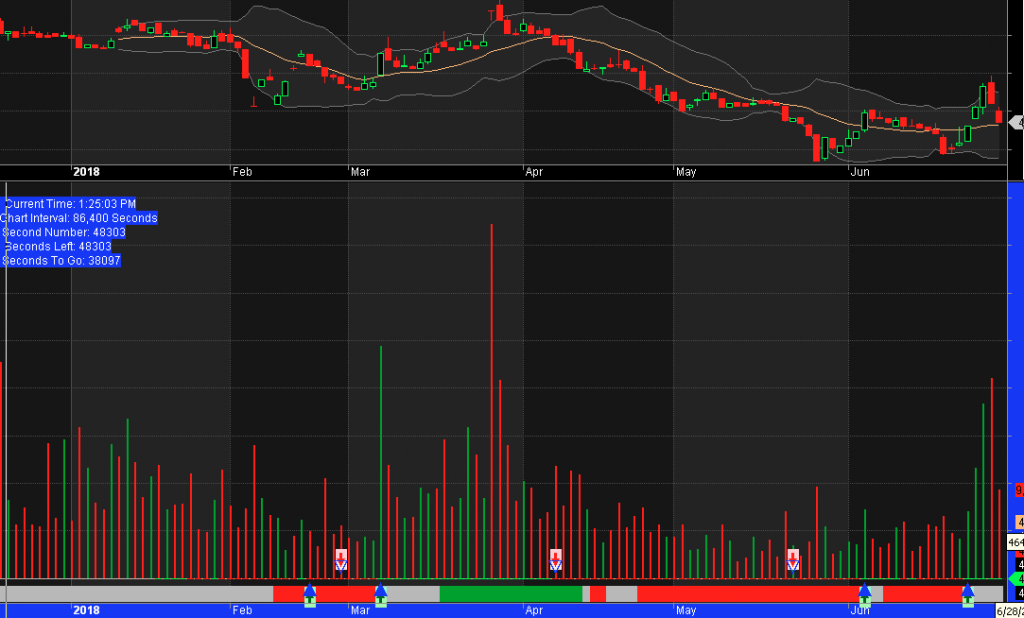
// Paste the code below to your price chart somewhere and green ribbon means both
// both MACD and ADX trending up so if the red ribbon shows up the MACD and the ADX
// are both trending down.
_SECTION_BEGIN(“trending ribbon”);
uptrend=PDI(20)>MDI(10)AND Signal(29)PDI(20)AND Signal(29)>MACD(13);
Plot( 3.5, /* defines the height of the ribbon in percent of pane width /”ribbon”, IIf( uptrend, colorGreen, IIf( downtrend, colorRed, 0 )), / choose color */
styleOwnScale|styleArea|styleNoLabel, -0.5, 100 );
_SECTION_END();
_SECTION_BEGIN(“EMA”);
P = ParamField(“Price field”,-1);
Periods = Param(“Periods”, 15, 2, 300, 1, 10 );
Plot( EMA( P, Periods ), _DEFAULT_NAME(), ParamColor( “Color”, colorCycle ), ParamStyle(“Style”) );
_SECTION_END();
_SECTION_BEGIN(“MACD Exploration”);
r1 = Param( “Fast avg”, 12, 2, 200, 1 );
r2 = Param( “Slow avg”, 26, 2, 200, 1 );
r3 = Param( “Signal avg”, 9, 2, 200, 1 );
Z=Param(“zig”,1,0,10,0.1);
Cond1 = Cross(MACD(r1,r2),Signal(r1,r2,r3));
Cond3 = Zig(C,z)>Ref(Zig(C,z),-2);
Buy = Cond1 AND Cond3;
Cond4 = Cross(Signal(r1,r2,r3),MACD(r1,r2));
Cond6 = Zig(C,z)<Ref(Zig(C,z),-2);
Sell = Cond4 AND Cond6;
Trigger = WriteIf(Buy, “Buy”, “”) + WriteIf(Sell, “Sell”, “”);
_N(Title = StrFormat(“{{NAME}} {{DATE}} {{INTERVAL}}: O=%1.2f, H=%1.2f, L=%1.2f, C=%1.2f, V=%1.0f\n{{VALUES}}”, O, H, L, C, V));
BG = IIf(Buy, colorGreen, IIf(Sell, colorRed, colorDefault));
FG = IIf(Buy, colorDarkGreen, IIf(Sell, colorDarkRed, colorDefault));
if(Status(“action”) == actionIndicator)
{
Plot(C, “”, colorGrey50, styleBar);
PlotShapes(IIf(Buy, shapeSquare, shapeNone),colorAqua, 0, L, Offset=-15);
PlotShapes(IIf(Buy, shapeSquare, shapeNone),colorPaleGreen, 0,L, Offset=-25);
PlotShapes(IIf(Buy, shapeUpArrow, shapeNone),colorDarkGreen, 0,L, Offset=-20);
PlotShapes(IIf(Sell, shapeSquare, shapeNone),colorRose, 0, H, Offset=15);
PlotShapes(IIf(Sell, shapeSquare, shapeNone),colorPink, 0,H, Offset=25);
PlotShapes(IIf(Sell, shapeDownArrow, shapeNone),colorRed, 0,H, Offset=-20);
}
if(Status(“action”) == actionExplore)
Filter = Buy OR Sell;
Action = WriteIf(Buy, “BUY”, WriteIf(Sell, “SELL”, ” “));
SetOption(“NoDefaultColumns”, True);
if (EndValue(Buy)==1) Say(“Buy”);
if (EndValue(Sell)==1) Say(“Sell”);
AddTextColumn(Name(), ” Symbol”, 77, colorDefault, IIf(Buy, colorBrightGreen, colorRed),110);
AddColumn( DateTime(),”Date / Time “, formatDateTime,colorDefault,IIf(Buy,colorBrightGreen,IIf(Sell,colorRed,Null)),150 );
//AddColumn(DateTime(), “Date”, formatDateTime, FG, BG, 140);
//AddColumn(TimeNum() ,”Time”,1);
AddColumn( C, “Close”, 1.2 ,colorDefault,colorDefault,67);
AddColumn( H, “High”, 1.2 ,colorDefault,colorDefault,67);
AddColumn(V, “Volume”,1,colorDefault,colorDefault,67);
AddColumn(Ref(V,-1),”P-Vol”,1,colorDefault,colorDefault,67);
AddColumn(V/Ref(V,-1)*100,”Increase in Vol”,1,colorDefault,colorDefault,77);
//AddTextColumn(Action, “Action”, 8.0, IIf(Buy, colorDarkGreen, colorDarkRed), colorWhite,67);
AddColumn( Buy, “Buy”, 1 );
AddColumn( Sell, “Sell”, 1 );
shape = Buy * shapeHollowUpTriangle + Sell * shapeHollowDownTriangle;
Plot( Close, “Price”, colorBlack, styleCandle );
PlotShapes( shape, IIf( Buy, colorBlue, colorBlue ), 0, IIf( Buy, Low, High ) );
GraphXSpace = 7;
shape = Buy * shapeUpTriangle + Sell * shapeHollowDownTriangle;
Plot( Close, “Price”, colorBlack, styleCandle );
PlotShapes( shape, IIf( Buy, colorBlue, colorBlue ), 0, IIf( Buy, Low, High ) );
GraphXSpace = 7;
_SECTION_END();
_SECTION_BEGIN(“Time Left”);
function GetSecondNum()
{
Time = Now( 4 );
Seconds = int( Time % 100 );
Minutes = int( Time / 100 % 100 );
Hours = int( Time / 10000 % 100 );
SecondNum = int( Hours * 60 * 60 + Minutes * 60 + Seconds );
return SecondNum;
}
RequestTimedRefresh( 1 );
TimeFrame = Interval();
SecNumber = GetSecondNum();
Newperiod = SecNumber % TimeFrame == 0;
SecsLeft = SecNumber – int( SecNumber / TimeFrame ) * TimeFrame;
SecsToGo = TimeFrame – SecsLeft;
if ( NewPeriod )
{
Say( “New period” );
Plot( 1, “”, colorYellow, styleArea | styleOwnScale, 0, 1 );
}
Title = “\n” +
" Current Time: " + Now( 2 ) + "\n" + "Chart Interval: " + NumToStr( TimeFrame, 1.0 ) + " Seconds\n" + " Second Number: " + NumToStr( SecNumber, 1.0, False ) + "\n" + " Seconds Left: " + NumToStr( SecsLeft, 1.0, False ) + "\n" + " Seconds To Go: " + NumToStr( SecsToGo, 1.0, False );
// Background color
SetChartBkColor(ParamColor(“Panel color “,colorBlue));
_SECTION_END();
_SECTION_BEGIN(“Volume”);
Plot( Volume, _DEFAULT_NAME(), IIf( C > O, ParamColor(“Up Color”, colorGreen ), ParamColor(“Down Color”, colorRed ) ), ParamStyle( “Style”, styleHistogram | styleThick, maskHistogram ) );
_SECTION_END();
Leave a Reply
You must be logged in to post a comment.