The Klinger Oscillator is used to determine long-term trends of money flow, while remaining sensitive enough to short-term fluctuations to predict short-term reversals. It compares the volume of money flowing in and out of a stock to the price movement, and it is then turned into an oscillator. A signal line (13-period moving average) is usually used to trigger buy/sell decisions. This technique is very similar to signals that are created with other indicators such as the MACD(moving average convergence divergence). The Klinger Oscillator also uses divergence to identify when price and volume are not confirming the direction of the move. It is considered to be a bullish sign when the value of the indicator is heading upward while the price of the stock continues to fall. It is recommended to use other tools such as trendlines, moving averages and other indicators to confirm the reversal.
It is modified and I you find it useful. All suggestions are welcome.
Thanks.
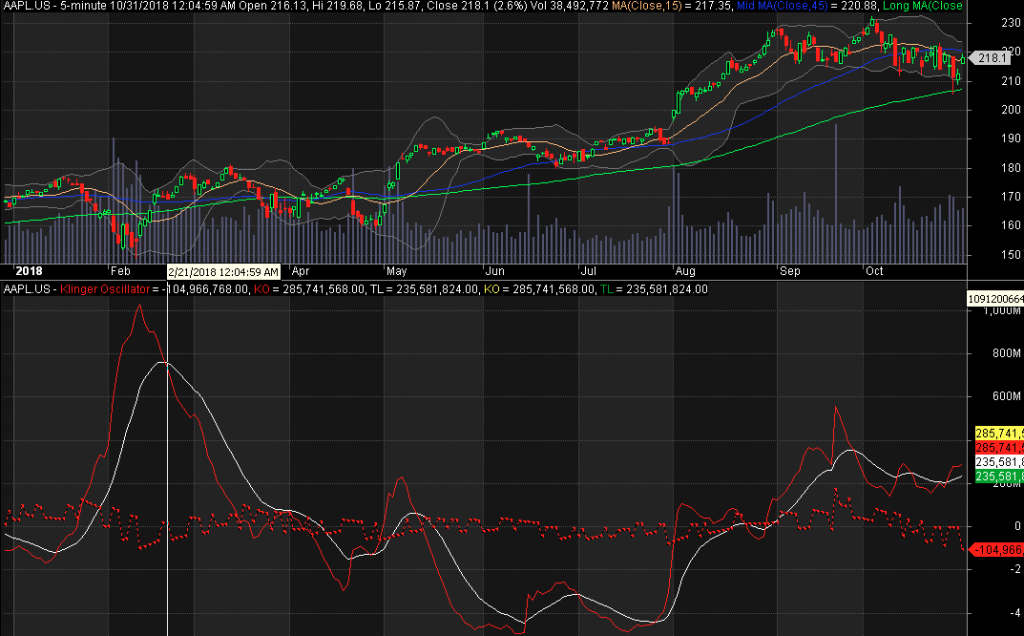
_SECTION_BEGIN("Klinger Oscillator");x = H+L+C;trend = IIf(x>Ref(x,-1), 1, -1);dm = (H-L);trend_dif = trend - Ref(trend, -1);cm_today = IIf(trend_dif != 0, Ref(dm, -1), 0);sf = IIf(trend_dif !=0, 1, 0);fb = IIf(trend_dif == 0, 1, 0);Cm0 = dm + fb * AMA(cm_today, 0);cm = dm + sf*Ref(dm, -1) + fb * AMA(cm_today, 0);Vf0 = (dm/cm -1 ) *2;Vf = Vf0 * V*trend*100;KO = EMA(Vf,34) - EMA(Vf,55);Plot(ko, _DEFAULT_NAME(), styleThick, ParamColor( "Color", colorGold), ParamStyle("Style") );a=H+L+C;b=Ref(a,-1);Trend=IIf(a > b, 1,-1);dm = H- L;Cm = Cum(dm);Cm = IIf(trend=-1,Ref(Cm,-1)+dm, Ref(dm,-1) + dm);Vf= V* (2 *( dm/Cm -1)) * trend * 100;KO = EMA(Vf,34) - EMA(Vf,55);Plot(ko,"KO",colorRed,styleLine);TL = EMA(KO,13);Plot(TL,"TL",colorWhite,styleLine);a=H+L+C;b=Ref(a,-1);Trend=IIf(a > b, 1,-1);dm = H- L;Cm = Cum(dm);Cm = IIf(trend=-1,Ref(Cm,-1)+dm, Ref(dm,-1) + dm);Vf= V* (2 *( dm/Cm -1)) * trend * 100;KO = EMA(Vf,34) - EMA(Vf,55);Plot(ko,"KO",colorYellow,styleLine);TL = EMA(KO,13);Plot(TL,"TL",colorGreen,styleLine);_SECTION_END();

Leave a Reply
You must be logged in to post a comment.