Chỉ số này được đưa ra bởi bạn tôi và nó cho kết quả tốt trong
giao dịch trong ngày, vì vậy hãy kiểm tra trước từ phía bạn để kiểm tra lại
Nếu bạn thỏa mãn thì THƯỞNG THỨC GIAO DỊCH
•Entry Rules
Going Long
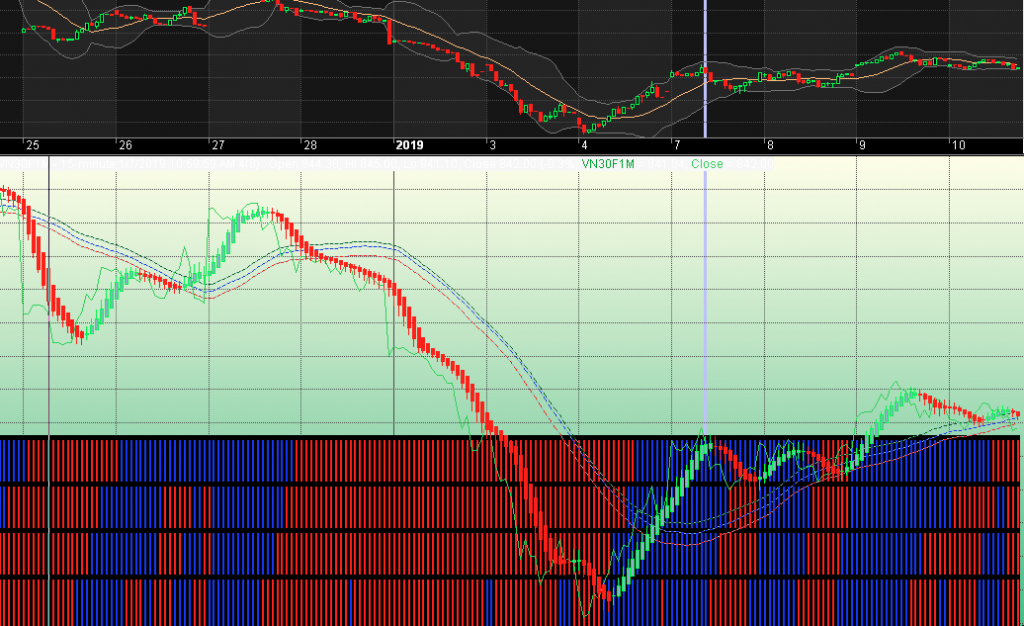
Khi thanh TF thấp nhất (Ví dụ 15 phút) chuyển từ màu đỏ sang màu xanh, chúng tôi cảnh báo về sự đảo chiều sắp xảy ra. Khi thanh của khung thời gian cao hơn tiếp theo thay đổi từ màu xanh đỏ, chúng tôi nhận được xác nhận về sự thay đổi xu hướng. Đây là thời gian để vào. Nếu thanh TF cao hơn vẫn chuyển từ màu đỏ sang màu xanh, chúng tôi sẽ xác nhận rằng bước đi hiện tại rất mạnh. Nếu thanh TF cao nhất cũng chuyển từ đỏ sang xanh, chúng ta đang di chuyển mạnh mẽ.

Exit
Khi màu khung thời gian thấp nhất thay đổi từ màu xanh sang màu đỏ, chúng tôi được cảnh báo rằng việc di chuyển hiện tại có thể kết thúc. Xác nhận đến từ thanh TF cao hơn tiếp theo cũng thay đổi từ màu xanh sang màu đỏ. Sau đó, chúng tôi thoát khỏi giao dịch.
Ngoài ra còn có một cách tiếp cận rủi ro hơn. Khi tất cả bốn TF có màu xanh lam (có nghĩa là di chuyển mạnh) và sự đảo ngược xảy ra, chúng tôi đợi cho đến khi ba TF thấp hơn chuyển màu xanh sang đỏ. Ở đây, mức giảm cao nhất có thể là rất lớn.
Going short and exits
Các điều kiện chính xác được đề cập ở trên trong thời gian dài nhưng màu sắc thay đổi từ màu xanh sang màu đỏ.
Chú thích:
Cũng lưu ý rằng các thanh HA tự cung cấp nhiều manh mối cho trạng thái di chuyển. thanh dài với bóng dài cho thấy sức mạnh. Thanh nhỏ với bóng nhỏ cho thấy di chuyển yếu
_SECTION_BEGIN(“System”);
SetChartOptions(0,chartShowArrows|chartShowDates);
Title = (“” + Name()+” ” + Date() +” “+Interval(2) +” “+ EncodeColor(colorLime)+”,Open “+Open +” ,High “+H+” ,Low “+L+” ,Close “+C+” “+”{{VALUES}}”);
per1=Param(“First Period”,6,2,30,1);
per2=Param(“Second Period”,2,2,30,1);
Om=MA(O,per1);
hm=MA(H,per1);
lm=MA(L,per1);
Cm=MA(C,per1);
//==============================================================================================================
HACLOSE=(Om+Hm+Lm+Cm)/4;
HaOpen = AMA( Ref( HaClose, -1 ), 0.5 );
HaHigh = Max( Hm, Max( HaClose, HaOpen ) );
HaLow = Min( Lm, Min( HaClose, HaOpen ) );
//PlotOHLC( HaOpen, HaHigh, HaLow, HaClose, “” + Name(), colorBlack, styleCandle | styleNoLabel );
Of=MA(Haopen,per2);
Cf=MA(Haclose,per2);
Lf=IIf(haOpen<haClose,MA(Halow,per2),MA(Hahigh,per2));
Hf=IIf(haOpen<haClose,MA(Hahigh,per2),MA(Halow,per2));
PlotOHLC( Of, Hf, Lf, Cf, “” + Name(), colorGreen, styleCandle | styleNoLabel );
Plot(C,”Close”,colorLime,styleLine);
//=======================================================================================================================
MO=MA(O,40);
ML=MA(L,40);
MH=MA(H,40);
Plot(MO,””,colorBlue,styleDashed);
Plot(ML,””,4,styleDashed);
Plot(MH,””,colorDarkGreen,styleDashed);
_SECTION_BEGIN(“Background text”);
C13=Param(“fonts”,20,10,30,1 );
C14=Param(“left-right”,2.1,1.0,5.0,0.1 );
C15=Param(“up-down”,12,1,20,1 );
Miny = Status(“axisminy”);
Maxy = Status(“axismaxy”);
lvb = Status(“lastvisiblebar”);
fvb = Status(“firstvisiblebar”);
pxwidth = Status(“pxwidth”);
pxheight = Status(“pxheight”);
GfxSetBkMode(transparent=1);
GfxSetOverlayMode(1);
GfxSelectFont(“Tahoma”, Status(“pxheight”)/C13 );
GfxSetTextAlign( 6 );
GfxSetTextColor( ColorRGB (217,217,213));
GfxTextOut( Name(), Status(“pxwidth”)/C14, Status(“pxheight”)/C15 );
GfxSelectFont(“Tahoma”, Status(“pxheight”)/C130.5 ); GfxSetTextColor( ColorRGB (103,103,103)); GfxSelectFont(“Tahoma”, Status(“pxheight”)/C130.5 );
GfxSetTextColor( ColorRGB (103,103,103));
GfxSelectFont(“MS Sans Serif”, 10, 500, False, False, 0);
_SECTION_BEGIN(“Background Color”);
BKswitch = ParamToggle(“Background Color”,”On,Off”);
OUTcolor = ParamColor(“Outer Panel Color”,colorLightBlue);
INUPcolor = ParamColor(“Inner Panel Upper”,colorLightYellow);
INDNcolor = ParamColor(“Inner Panel Lower”,colorSeaGreen);
TitleColor = ParamColor(“Title Color “,ColorRGB(245,245,245));
if (NOT BKswitch)
{
SetChartBkColor(OUTcolor); // color of outer border
SetChartBkGradientFill(INUPcolor,INDNcolor,TitleColor); // color of inner panel
}
_SECTION_END();
/*1. Here are some observations to keep in mind that will help assure
you are in a good trending move which is detrimental to the success
of the trade moving higher before the inevitable over exhausted trend.
2 Consider only going long on the 5M if the 30M (two rows above) is also blue.
3 Consider the 1hr row as well being blue since it has an effect too.
4 The 15M row has to be blue with NO exceptions
5 The 30M row if blue has less effect on the trade as compared to the 15M row
but keep this in mind. The 30M row being blue helps the 15M row continue to stay blue.
6 The 1hr row has even less effect OR importance but it too keeps the 30M
from weakening to some minor degree.
*/
// Define label bar (x) position location
blankRightBars = 5; //insert actual blank right bars specified in Preferences
barsInView = Status(“lastvisiblebarindex”) – Status(“firstvisiblebarindex”) – blankRightBars;
Offset = Param(“Offset Bar”, 0.95, 0, 1, 0.01);
textOffset = BarCount – (Offset * barsInView);
_SECTION_BEGIN(“default”);
HaClose =EMA((O+H+L+C)/4,3);
HaOpen = AMA( Ref( HaClose, -1 ), 0.5 );
HaHigh = Max( H, Max( HaClose, HaOpen ) );
HaLow = Min( L, Min( HaClose, HaOpen ) );
PlotText(“Heinkein 4T tf :”+Interval(2), textoffset, 41.01, colorYellow);
Color = IIf( Haopen > Haclose,4, IIf( Haopen == Haclose,colorYellow, 6));
Plot(10,””, Color, styleHistogram+styleThick|styleOwnScale|styleNoLabel, 0, 100 );
Plot( 11,””,colorBlack,styleOwnScale|styleArea|styleNoLabel,0, 100 );
_SECTION_BEGIN(“2”);
Compress2= Param(“Compression”,2,1,3,1);
TimeFrameSet(Compress2* Interval());
HaClose2 =EMA((O+H+L+C)/4,3);
HaOpen2 = AMA( Ref( HaClose2, -1 ), 0.5 );
HaHigh2 = Max( H, Max( HaClose2, HaOpen2 ) );
HaLow2 = Min( L, Min( HaClose2, HaOpen2 ) );
PlotText(“Heinkein 4T tf :”+Interval(2), textoffset, 41.055, colorYellow);
TimeFrameRestore();
HAopen2f=TimeFrameExpand( Haopen2, Compress2* Interval());
Haclose2f=TimeFrameExpand( Haclose2, Compress2* Interval());
HaHigh2f=TimeFrameExpand( Hahigh2, Compress2* Interval());
HaLow2f=TimeFrameExpand( Halow2, Compress2* Interval());
Color2 = IIf( Haopen2f > Haclose2f,4, IIf(Haopen2f == Haclose2f,colorYellow, 6));
Plot(20,””, Color2, styleHistogram+styleThick|styleOwnScale|styleNoLabel, 0, 100 );
Plot( 21,””,colorBlack,styleOwnScale|styleArea|styleNoLabel,0, 100 );
_SECTION_BEGIN(“3”);
Compress3= Param(“Compression3”,4,2,6,1);
TimeFrameSet(Compress3* Interval());
HaClose3 =EMA((O+H+L+C)/4,3);
HaOpen3 = AMA( Ref( HaClose3, -1 ), 0.5 );
HaHigh3 = Max( H, Max( HaClose3, HaOpen3 ) );
HaLow3 = Min( L, Min( HaClose3, HaOpen3 ) );
PlotText(“Heinkein 4T tf :”+Interval(2), textoffset,41.10, colorYellow);
TimeFrameRestore();
HAopen3f=TimeFrameExpand( Haopen3, Compress3* Interval());
Haclose3f=TimeFrameExpand( Haclose3, Compress3* Interval());
HaHigh3f=TimeFrameExpand( Hahigh3, Compress3* Interval());
HaLow3f=TimeFrameExpand( Halow3, Compress3* Interval());
color3 = IIf( Haopen3f > Haclose3f,4, IIf( Haopen3f == Haclose3f,colorYellow,6));
Plot(30,””, Color3, styleHistogram+styleThick|styleOwnScale|styleNoLabel, 0, 100 );
Plot( 31,””,colorBlack,styleOwnScale|styleArea|styleNoLabel,0, 100 );
_SECTION_BEGIN(“4”);
Compress4= Param(“Compression4”,8,2,10,1);
TimeFrameSet(Compress4* Interval());
HaClose4 =EMA((O+H+L+C)/4,3);
HaOpen4 = AMA( Ref( HaClose4, -1 ), 0.5 );
HaHigh4 = Max( H, Max( HaClose4, HaOpen4 ) );
HaLow4 = Min( L, Min( HaClose4, HaOpen4 ) );
PlotText(“Heinkein 4T tf :”+Interval(2), textoffset, 41.14, colorYellow);
TimeFrameRestore();
HAopen4f=TimeFrameExpand( Haopen4, Compress4* Interval());
Haclose4f=TimeFrameExpand( Haclose4, Compress4* Interval());
HaHigh4f=TimeFrameExpand( Hahigh4, Compress4* Interval());
HaLow4f=TimeFrameExpand( Halow4, Compress4* Interval());
Color4 = IIf( Haopen4f > Haclose4f,4, IIf( Haopen4f == Haclose4f ,colorYellow, 6));
Plot(40,””, Color4, styleHistogram+styleThick|styleOwnScale|styleNoLabel, 0, 100 );
Plot( 41,””,colorBlack,styleOwnScale|styleArea|styleNoLabel,0, 100 );
_N(Title = “{{NAME}} – {{INTERVAL}} {{DATE}} “+_DEFAULT_NAME()+” : {{OHLCX}} {{VALUES}}” );
Leave a Reply
You must be logged in to post a comment.