The Force Index, developed by Alexander Elder, is an indicator that uses price and volume to assess the power behind a move or identify possible turning points. The Force Index was introduced in his classic book, Trading for a Living. According to Elder, there are three essential elements to a stock’s price movement: direction, extent and volume. The Force Index combines all three as an oscillator that fluctuates in positive and negative territory as the balance of power shifts. The Force Index can be used to assess the overall trend, identify playable corrections or foreshadow reversals with divergences.
_SECTION_BEGIN("Force Index");SetPositionSize(1000,spsShares);Period1=Optimize("Period1",17,1,20,1);Period2=Optimize("Period2",5,2,20,1);L1=Optimize("L1",-310000,-500000,50000,10000);L2=Optimize("L2",-410000,-500000,50000,10000);FI =((Close- Ref(Close, -1)) * V);FastAvgFI=LinearReg(FI,Period1);SlowAvgFI=LinearReg(FI,Period2);FI_Col = IIf( (FI <Ref(FI,-1)), colorRed, colorBrightGreen);FastAvgFI_Col = IIf(FastAvgFI < 0, colorRed, colorBlue);SlowAvgFI_Col = IIf(SlowAvgFI < 0, colorRed, colorBlue);Plot(FI, "Force Index", FI_Col, styleHidden|styleThick);Plot(FastAvgFI, "FastAvgFI", FastAvgFI_Col, styleLine|styleThick);Plot(SlowAvgFI, "SlowAvgFI", SlowAvgFI_Col, styleLine|styleThick);Plot(0,"", colorViolet, styleLine| styleThick);Buy=Cover=(Cross(SlowAvgFI,L1))AND(FastAvgFI>L2) ;Sell=Short=((Cross(0,FastAvgFI))OR(Cross(0,SlowAvgFI)ANDFastAvgFI<SlowAvgFI));Long=Flip(Buy,Sell);Shrt=Flip(Sell,Buy);PlotShapes( IIf( Sell, shapeDownArrow, shapeNone), colorRed, 0, High, Offset = -25 );PlotShapes( IIf( Buy, shapeUpArrow, shapeNone), colorBrightGreen, 0, Low, Offset = -25 );
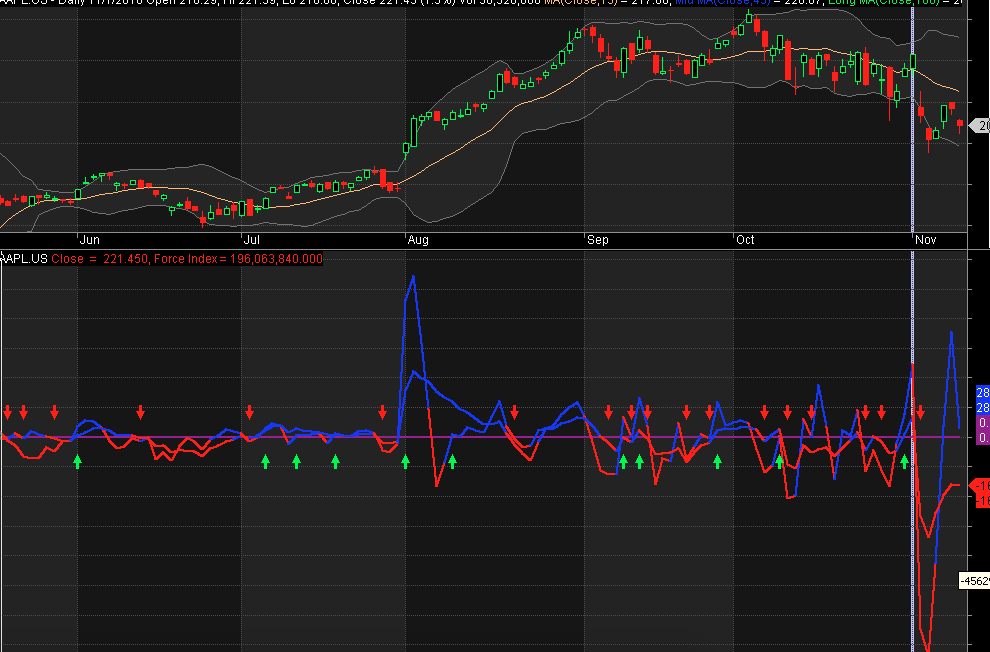
Title = Name() +EncodeColor(colorRed) + " Close "+EncodeColor(colorRed) + " = "+ WriteVal(Close) + ", "+EncodeColor(colorRed) + "Force Index = "+EncodeColor(colorRed) + WriteVal(FI);_SECTION_END();
Leave a Reply
You must be logged in to post a comment.