– Normally it should be a signal of reversal of the current Trend.
– You can find it in the variants: Bullish and Bearish, depending on the Trend in which is located.
– Is a rare Pattern and not so reliable.
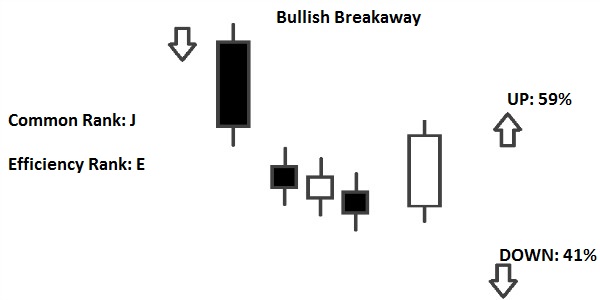
– It occurs during a Downtrend; confirmation is required by the candles that follow the Pattern.

– The First Candle is long and black.
– Then there is a Gap Down.
– The next Candles are Spinning Tops (With Short Real Bodies), that make new Lows (Are usually Three Candles).
– The Last Candle is long and white, it has the Close within the range of the Gap Down.
– The Second and Fourth Candle, should be black to have a further confirmation of the Pattern.
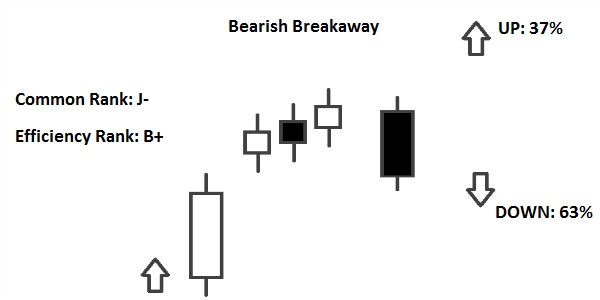
It occurs during an Uptrend; confirmation is required by the candles that follow the Pattern.
– The First Candle is long and white.
– Then there is a Gap Up.
– The next Candles are Spinning Tops (With Short Real Bodies), that make new Highs (Are usually Three Candles).
– The Last Candle is long and black, it has the Close within the range of the Gap Up.
– The Second and Fourth Candle, should be white to have a further confirmation of the Pattern.

Leave a Reply
You must be logged in to post a comment.