Chiến lược giao dịch trong ngày dựa trên khối lượng, phù hợp với các nhà giao dịch algo. Điều kiện mua và bán dựa trên Khối lượng ngày hôm trước. Giá kích hoạt, thời gian bắt đầu, thời gian kết thúc, dừng lỗ và mục tiêu đã được thêm vào.
///Volume Based Intraday AFl for algo traders
///Created by Team Viatrades
///viatradess@gmail.com
SetPositionSize(1, spsShares);
SetBarsRequired(sbrAll, sbrAll);
SetChartOptions(0,chartShowArrows|chartShowDates);
SetChartBkGradientFill(colorBlack,colorBlack,colorBlack);
SetBarFillColor(IIf(C>O,colorPaleBlue,IIf(C<=O,colorOrange,colorLightGrey))); Plot(C,”\nPrice”,IIf(C>O,colorPaleBlue,IIf(C<=O,colorOrange,colorLightGrey)),64|styleNoTitle,0,0,0,0);
GraphXSpace = 10;
// Time Given for MCX You can Change this
StartTime = ParamTime(“Start Time”, “10:00:00”);
StopTime = ParamTime(“End Time”, “23:00:00”);
Target = Param(“Target %”, 1, 0.1, 50, 0.01)/100;
StopLoss = Param(“Stop Loss %”, 0.6, 0.1, 50, 0.01)/100;
DCAL = DateNum();
HCAL = 0;
HCALPrice = 0;
LCALPrice = 0;
CurDNPrice = 0;
FirDNDNPrice = DCAL[0];
TN = TimeNum();
DT = DateTime();
LDT = DT[BarCount-1];
VOLPRICECAL = Null;
VOLLOWPRICECAL = Null;
HIGPRCCALC = Null;
LOWPRCCALC = Null;
PrevDay = 0;
for(i = 1; i < BarCount; i++)
{
if(CurDNPrice != DCAL[i] && FirDNDNPrice != DCAL[i])
{
VOLPRICECAL = HCALPrice;
VOLLOWPRICECAL = LCALPrice;
CurDNPrice = DCAL[i]; HCAL = 0; HCALPrice = 0; LCALPrice = 0; HIGPRCCALC[i-1] = Null; LOWPRCCALC[i-1] = Null; } HIGPRCCALC[i] = VOLPRICECAL; LOWPRCCALC[i] = VOLLOWPRICECAL; if(HCAL < Volume[i]) { HCAL = Volume[i]; HCALPrice = High[i]; LCALPrice = Low[i]; }
}
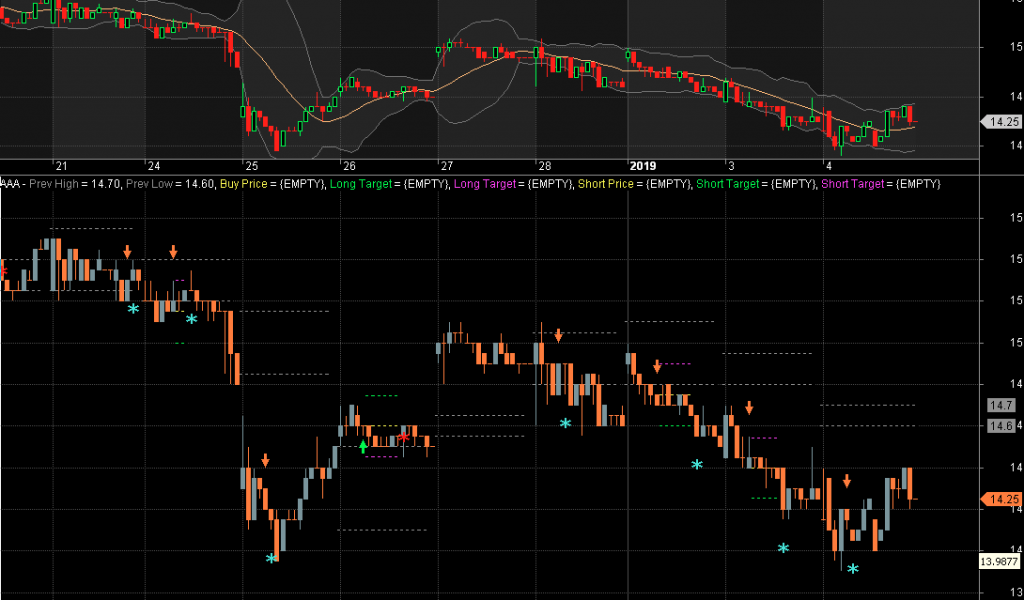
Plot(HIGPRCCALC, “Prev High”, colorGrey50, styleStaircase|styleDashed);
Plot(LOWPRCCALC, “Prev Low”, colorGrey50, styleStaircase|styleDashed);
Buy = Ref(Close > HIGPRCCALC, -1) AND TN > StartTime AND TN < StopTime AND TN > Ref(TN, -1);
Short = Ref(Close < LOWPRCCALC, -1) AND TN > StartTime AND TN < StopTime AND TN > Ref(TN, -1);
Sell = Ref(Close < LOWPRCCALC, -1) OR TN >= StopTime;
Cover = Ref(Close > HIGPRCCALC, -1) OR TN >= StopTime;
Buy = ExRem(Buy, Sell);
Sell = ExRem(Sell, Buy);
Short = ExRem(Short, Cover);
Cover = ExRem(Cover, Short);
BuyPrice = ValueWhen(Buy, Open);
ShortPrice = ValueWhen(Short, Open);
SellPrice = ValueWhen(Sell, Open);
CoverPrice = ValueWhen(Cover, Open);
LongTargetPrice = BuyPrice + (BuyPrice * Target);
ShortTargetPrice = ShortPrice – (ShortPrice * Target);
LongSLPrice = BuyPrice – (BuyPrice * Target);
ShortSLPrice = ShortPrice + (ShortPrice * Target);
Sell1 = High > LongTargetPrice;
Sell2 = Low < LongSLPrice;
Cover1 = Low < ShortTargetPrice; Cover2 = High > ShortSLPrice;
Sell = Sell OR Sell1 OR Sell2;
Cover = Cover OR Cover1 OR Cover2;
SellPrice = IIf(Sell1, LongTargetPrice, IIf(Sell2, LongSLPrice, SellPrice));
CoverPrice = IIf(Cover1, ShortTargetPrice, IIf(Cover2, ShortSLPrice, CoverPrice));
Buy = ExRem(Buy, Sell);
Sell = ExRem(Sell, Buy);
Short = ExRem(Short, Cover);
Cover = ExRem(Cover, Short);
BuyPlotsCandles = (BarsSince(Buy)BarsSince(Short)) AND (BarsSince(Short)!=0);
Plot(IIf(BuyPlotsCandles, BuyPrice, Null), “Buy Price”, colorYellow, styleStaircase|styleDashed);
Plot(IIf(BuyPlotsCandles, LongTargetPrice, Null), “Long Target”, colorBrightGreen, styleStaircase|styleDashed);
Plot(IIf(BuyPlotsCandles, LongSLPrice, Null), “Long Target”, colorCustom12, styleStaircase|styleDashed);
Plot(IIf(ShortPlotCandles, ShortPrice, Null), “Short Price”, colorYellow, styleStaircase|styleDashed);
Plot(IIf(ShortPlotCandles, ShortTargetPrice, Null), “Short Target”, colorBrightGreen, styleStaircase|styleDashed);
Plot(IIf(ShortPlotCandles, ShortSLPrice, Null), “Short Target”, colorCustom12, styleStaircase|styleDashed);
Buyshape = Buy * shapeUpArrow;
SellShape = Sell * shapeStar;
PlotShapes( Buyshape, colorBrightGreen, 0, Low );
PlotShapes( SellShape, colorRed, 0, High );
Shortshape = Short * shapeDownArrow;
CoverShape = Cover * shapeStar;
PlotShapes( Shortshape, colorOrange, 0, High, -30);
PlotShapes( CoverShape, colorTurquoise, 0, Low, -30 );
Leave a Reply
You must be logged in to post a comment.