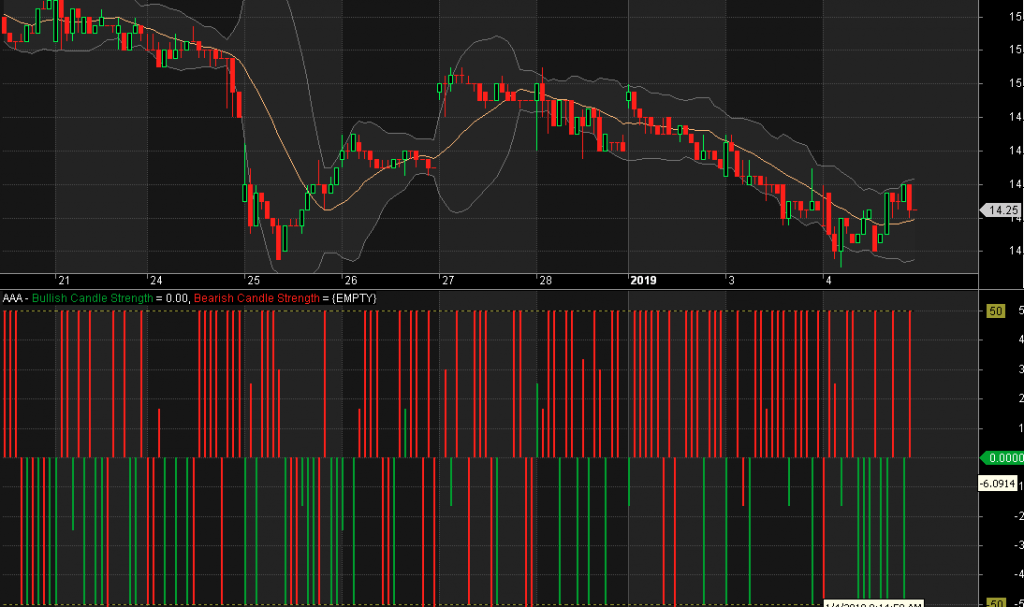
Chỉ báo này cho phép bạn hình dung độ mạnh của nến hiện tại bằng cách so sánh các giá trị OHLC. Giá trị biểu đồ màu đỏ đại diện cho nến giảm trong khi giá trị biểu đồ màu xanh lá cây đại diện cho nến tăng.
value = 100*(Open-Low)/(High-Low)-50;
bullishCandleStrength = IIf(Close > Open, value, 0);
bearishCandleStrength = IIf(Close <= Open, value, 0);
Plot(bullishCandleStrength, “Bullish Candle Strength”, colorGreen, styleHistogram | styleThick);
Plot(bearishCandleStrength, “Bearish Candle Strength”, colorRed, styleHistogram | styleThick);
Plot(50, “”, colorDarkYellow, styleDashed);
Plot(-50, “”, colorDarkYellow, styleDashed);
Leave a Reply
You must be logged in to post a comment.